Chrome Developer Tools
In “Debugging Your Tagging – Part 1“, I wrote about some of the extensions and tools that I use regularly while developing, testing and debugging tagging implementations. This post will look at some tips for you to get the most out of the Chrome Dev Tools.
Regular Expressions in the Network panel filter
The filter panel is very useful, but sometimes there is a lot of stuff coming through it which can obscure the things you’re looking for. The filter box at the top if one of the most frequently used parts of my browser, and it’s more than just a simple text filter.
If you start and end your filter text with forward slashes then it will treat it as a regular expression. This means that you can really speed up debugging, especially if you’re adding multiple tags at once.
Say you’ve added a DoubleClick tag and a Generic conversion pixel at the same time, and you want to check they are both firing on the same page. Adding a filter on the Network tab and browsing to the page is quick and easy, and if you only have two tags on a single page then checking one and then changing the filter is also a simple step. However if you have two tags to check across three of four pages, then it can get tiresome repeatedly swapping the filters, and if the search terms aren’t things that are easy to remember (like account IDs or long identifiers) then using a single filter for both will save lots of time.
In this screenshot I’ve added a single filter to check for a DoubleClick account ID and also an ID of another conversion tag I’ve just added.
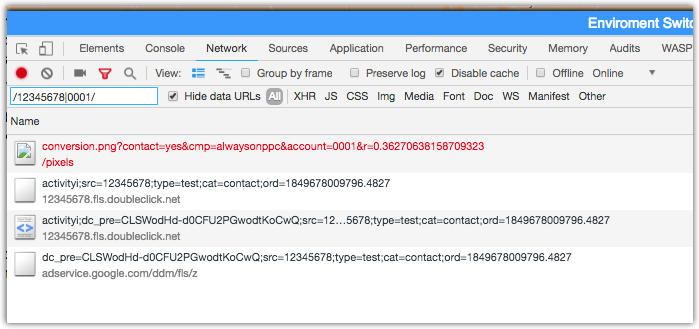
Using this single “or” regex (the pipe or vertical line character) I can leave the single filter on and check all the pages where the tags should appear, without having to repeatedly change the filter.
Remember to tick the “preserve log” checkbox as well if you want to do a single testing run and then check all the tags at the end.
And Network isn’t the only part of Dev Tools that can be filtered.
Filter the console output
Most sites I look at have an awful lot of noise happening in the console, which can make it tricky to find individual debugging messages fired from your tags.
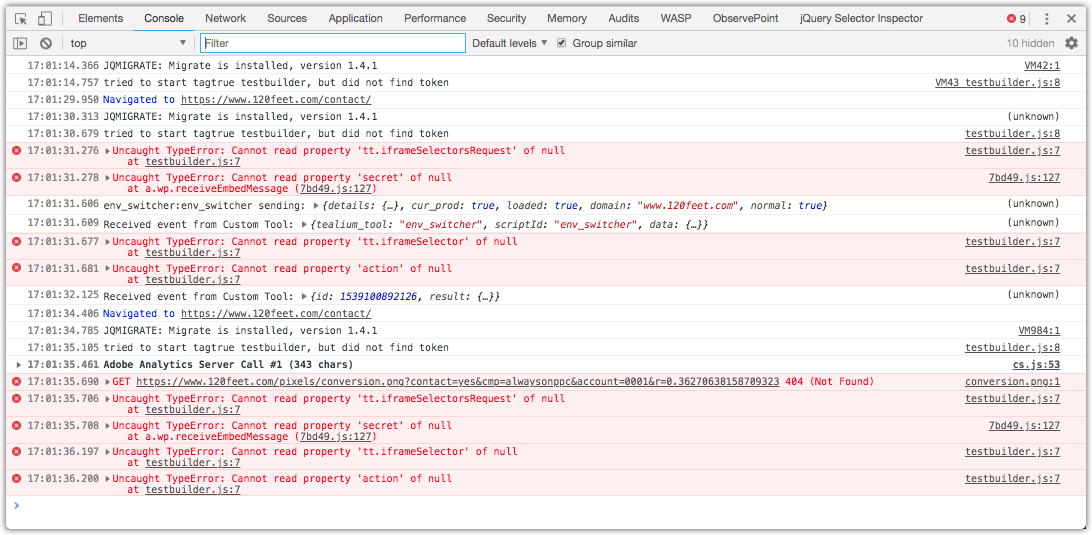
Most of these errors are coming from an extension that is active but not being used, so they are just getting in the way. You can use the filter box on the console to hide things, using the “-url” syntax. Or you can right click on a message and select “Hide messages from…”. This will add the line to the filter box for you.
Much tidier:
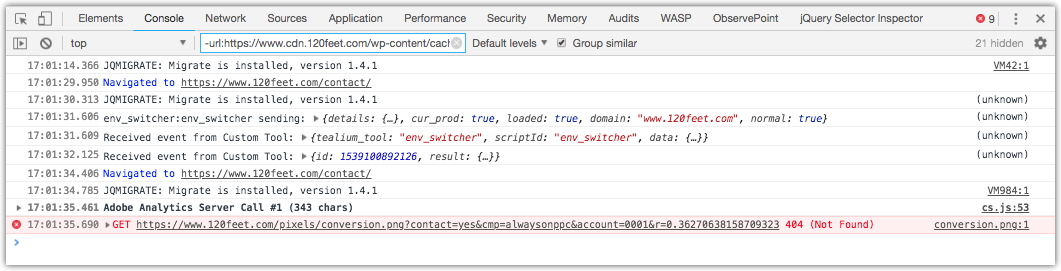
The filter string here is:
-url:https://www.cdn.120feet.com/wp-content/cache/minify/7bd49.js -url:chrome-extension://oghoceohpfhokhcoomihkobmpbcljall/testbuilder.js
This is applying two filters, both are based on the url source of the message.
You can also filter on the type of message; click the “Default levels” drop down and select just the levels you want, for example only warnings or just warnings and errors.
Rich Output in the Console
If you want your console logging to be easier to spot, you can add formatting rules, or even output things as tables.
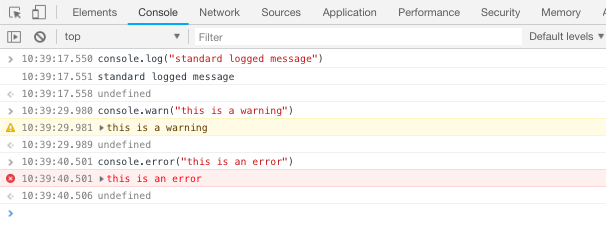
At a basic level, you can output as a warning (yellow background) or an error (red background).
But you can go so much further using the formatting options on the standard console.log message:
console.log('%c Here\'s a colourful message', 'background: #d26b0f; color: #eee');
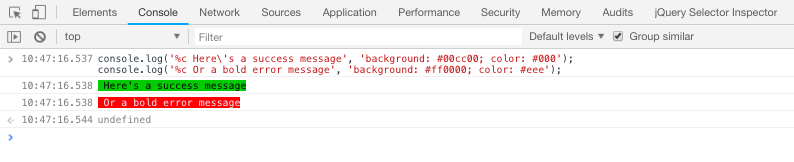
You can put pretty much any CSS property in the second parameter to format the message. I’ve used this before to flag the start and finish of async off site processes (ie JSON being posted and received) in the console, so you can see quickly whether the messages have been sent and returned.
You can also build data objects in the console and output into a nice easy to read table:
(function() {sources
var url = location;
var querystring = location.search.slice(1);
var tab = querystring.split("&").map(function(qs) {
  return { "Key": qs.split("=")[0], "Value": qs.split("=")[1], "Pretty Value": decodeURIComponent(qs.split("=")[1]).replace(/\+/g," ") }
});
console.group("Querystring Values");
console.log("URL: "+url+"\nQS: "+querystring);
console.table(tab);
console.groupEnd("Querystring Values");

})();
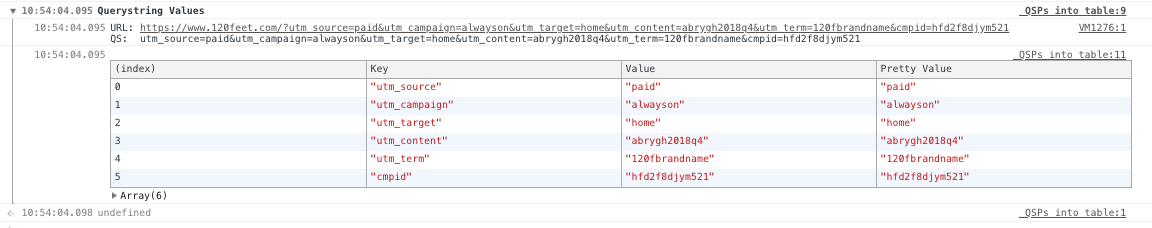
There are two useful methods here:
- console.group creates a collapsible group of messages (you can see the arrow and line on the left). Use console.groupEnd with the same key name to end the group
- console.table creates the table of values. This is built from an array of objects, where each object has three properties. This object is built using the .map() method in the code above
There are a lot more useful console methods, documentation is here.
Breakpoints in the sources panel
My final Chrome tip is about adding breakpoints to the source code that is running on the page.
Coming from a development background (ten years using ASP.net with C#, and before that Java), the concept of adding breakpoints and stepping through code is very familiar and seems a very obvious step when trying to get to the bottom of something. But I have been reminded recently that most digital marketers aren’t developers, and aren’t even aware of the term “breakpoint” or the fact that a modern browser allows you to step through JS line by line.
The Chrome JS debugger is in the Source panel. You can use this to open any script file that the page loads, whether first or third party.
A breakpoint is effectively an instruction to the browser to stop (“break”) at the line (“point”), and allow you to look at the state and values of the objects and variables at that point. You can then “step through” the code, which is moving execution on one statement at a time, and therefore work out if the code is correct or not.
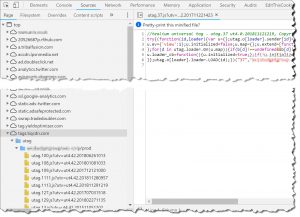
When you click on a source file, the script is loaded in the main part of the panel. This is generally “minified” – basically this means that the file has been made as small as possible by removing white space and new lines, which can make it hard to read. The little button with “{}” at the bottom will “prettify” the script and make it readable.
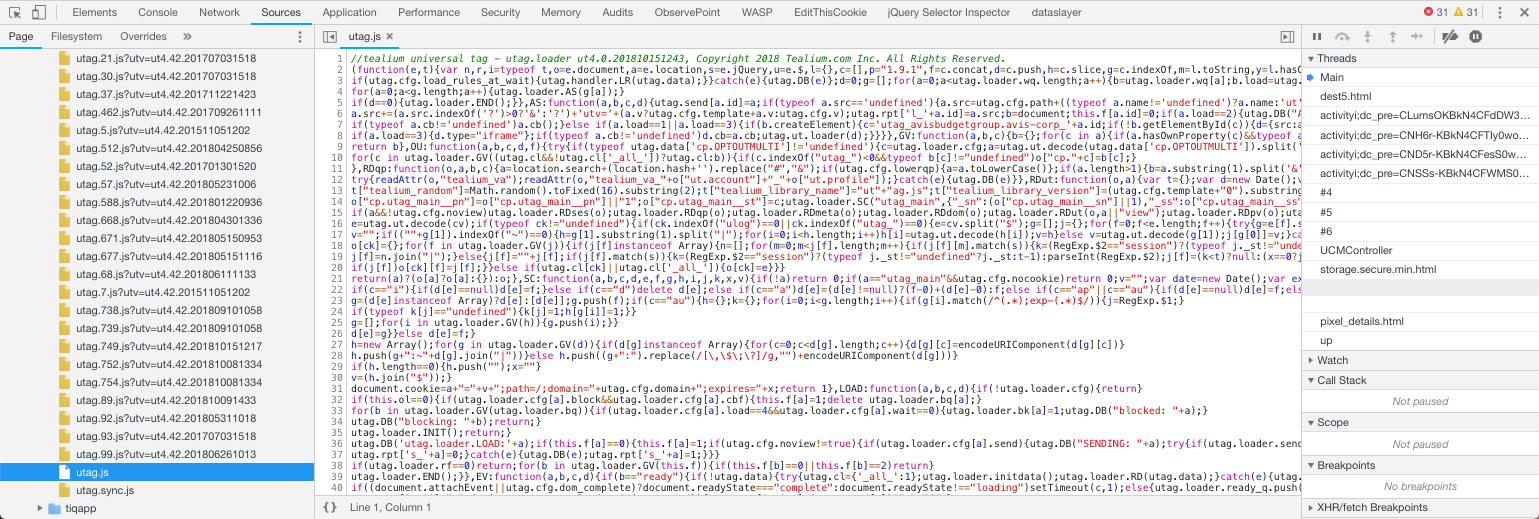
Adding a breakpoint is as simple as clicking to the left of the line number. A blue highlight will appear on the line number and over part of the line in the source. An entry will appear in the right hand panel under the “Breakpoints” accordion.
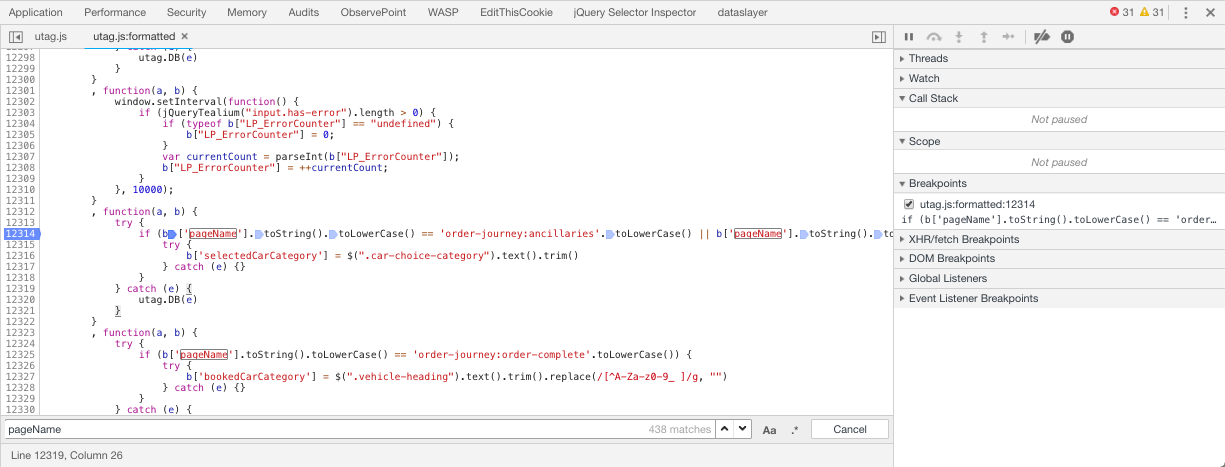
When you reload the page, the browser will stop when you hit this point. The whole line will be highlighted blue.
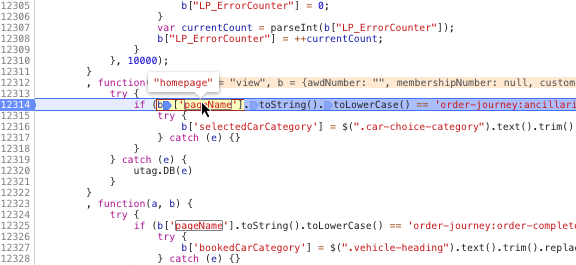
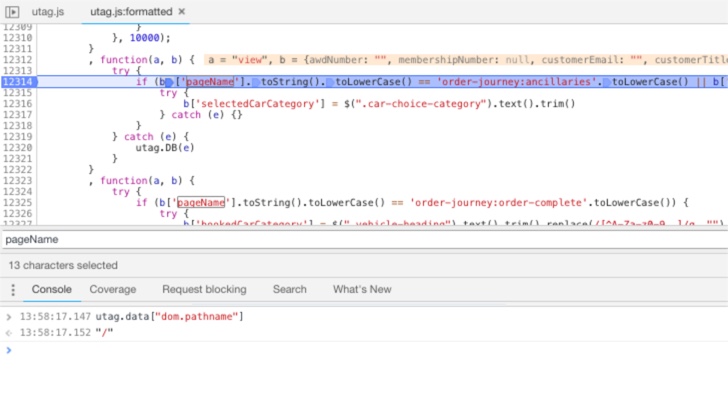
How the really useful part is that you can hover over a variable to see the value, or you can open the console drawer, and use the console to look at the values of things. Sometimes you might need to select/highlight more than just the variable, for example if you want to check the value of b[“pageName”], you need to highlight the whole thing. This can be a bit tricky because the highlight colour is the same blue as the breakpoint blue.
You can even use the console to update the values of variables! This means you can spoof particular scenarios that might be difficult to get into. For example, if some code is only meant to run if the browser is located in Italy, but you’re not, then you can overwrite the value of the location variable to pretend you are.
To progress through the code, use the buttons at the top of the right hand side to resume execution, step over a line, step into or out of a function, or just move on to the next statement.
There are a few other rules (mainly around lines you can’t add breakpoints to), but you’ll get the hang of it with some practice.
Overwrite built in functions to get more information
This one is a bit more techy…
You’ve added some click handlers to page elements, and for some reason each button click is getting recorded twice, but with slightly different parameters. This implies there are two different extensions firing utag.link when this event happens.
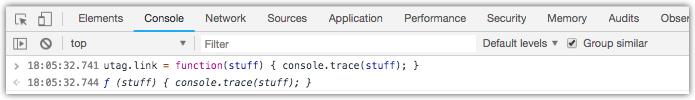
One elegant way to find out which extensions are firing is to overwrite the utag.link in the Console:
(You could overwrite the view function, although you will likely have to use a preloader JS extension to do the view as a view is usually called on page load so utag.js will set it back to its original value when it runs.)
Then when you do the click, you can see if link is being called more than once.
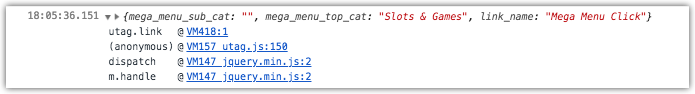
If there is more than one entry for (anonymous) with a link to the utag.js, then there are multiple extensions handling this click. Follow the link into the utag.js file and it should be easy enough to work out where it’s coming from.
In part 3, some more specific Tealium related tips and pointers.
Ben Stephenson has worked as a consultant for 120Feet for nearly three years. He has ten years of development experience on ecommerce websites, and five years of Digital Marketing experience as an ecommerce manager looking after a large multinational collection of websites for a Travel and Tourism company. In his spare time he plays guitar, builds with Lego and takes photos (sometimes featuring the guitar or the Lego).