At the end of October 2020 Microsoft released Clarity, a free website experience analytics tool. See the press release here. It is an experience analytics tool in the same vein as Content Square or Decibel Insight, offering heatmaps, session replay and reporting on frustration indicators such as Rage Clicks and Excessive Scrolling.
We added the code to our website to see how easy it is to get set up, what kind of reports you get and how they compare to the expensive alternatives.
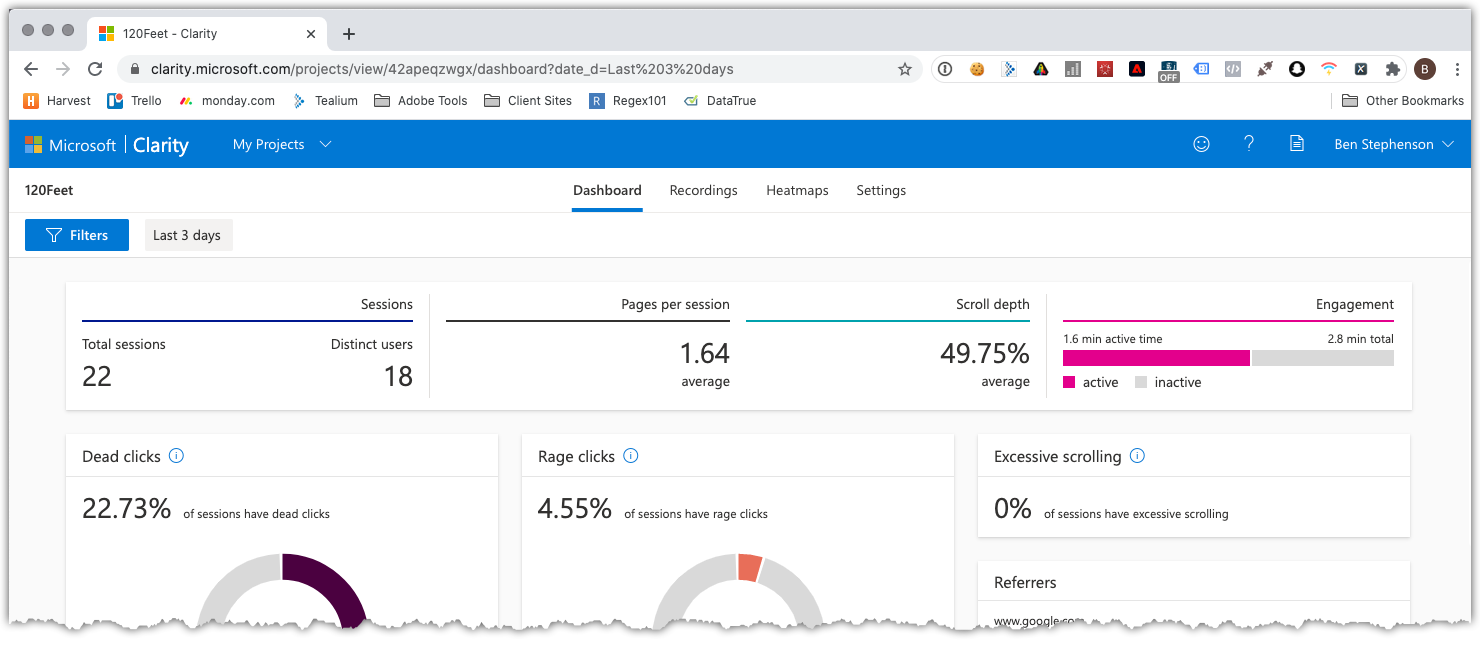
Update 20th November: After posting a link to this article on Linked In, we looked at the reports in Clarity to see how people interacted with the page. The average page depth was just under 50%, which I think means that most people didn’t actually get to the part where I talk about the available reports. So to make it easier to get there rather than scrolling through the TMS instructions, here are some jump links:
Installing on Tealium
Installing on Adobe Launch
Default Reports
Viewing a Recording
Heatmaps
Summary
Installation
First, open clarity.microsoft.com. You will need to log in to your Microsoft 365 account, and you may need your company administrator to activate it.
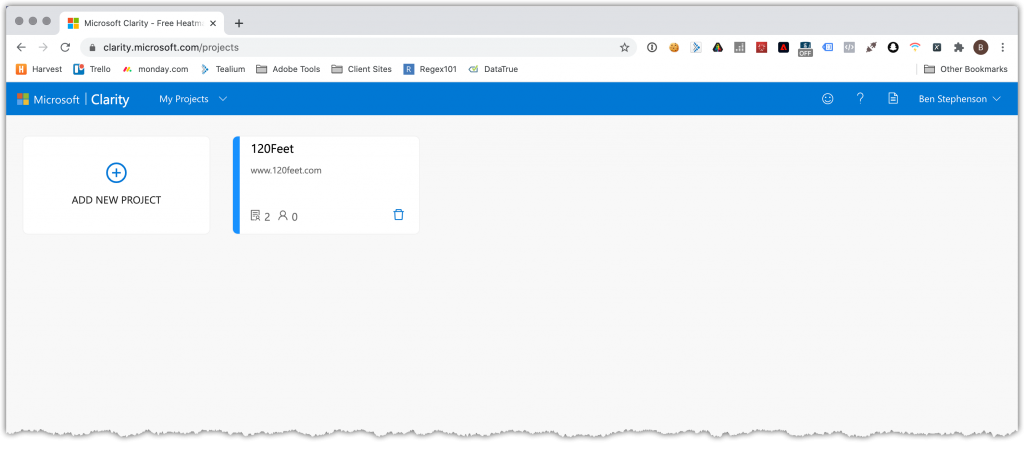
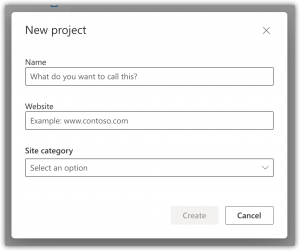
Once you’ve logged in you create a project by clicking the “Add New Project” button. Enter your project name, URL and a site category. It looks like you’re not limited by the number of domains or sites that you can add.
You are then given the JavaScript code which is needed to install the tool on your site. There are instructions for a variety of Tag Managers (but not Tealium iQ, and they have included Adobe DTM rather than Launch). Follow the instructions to embed the code on your site. I’ve written some instructions for iQ and Launch below.
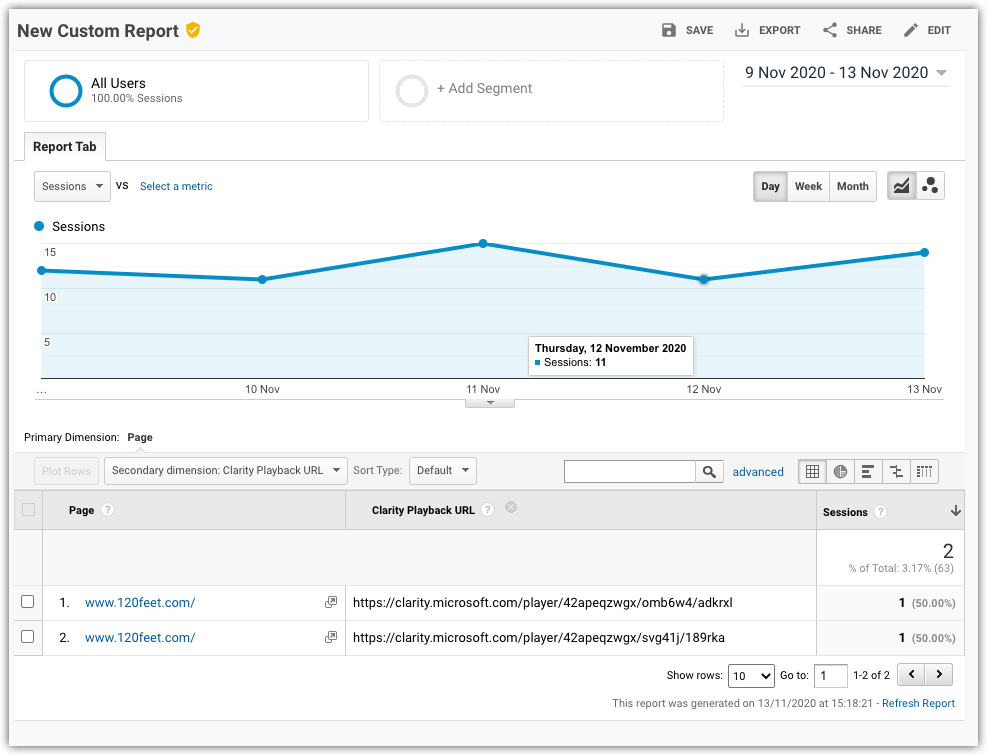
Once you have set up the project, you can also link it to your Google Analytics account. Click on Settings in the top navigation, then Setup in the left bar and scroll down to underneath the code box. Enter your GA details.
This will create a new custom dimension in your GA property which will contain a link to the session replay page. This gives you an easy way to link your ecommerce reporting with the behavioural reporting available in Clarity.
Installing on Tealium IQ
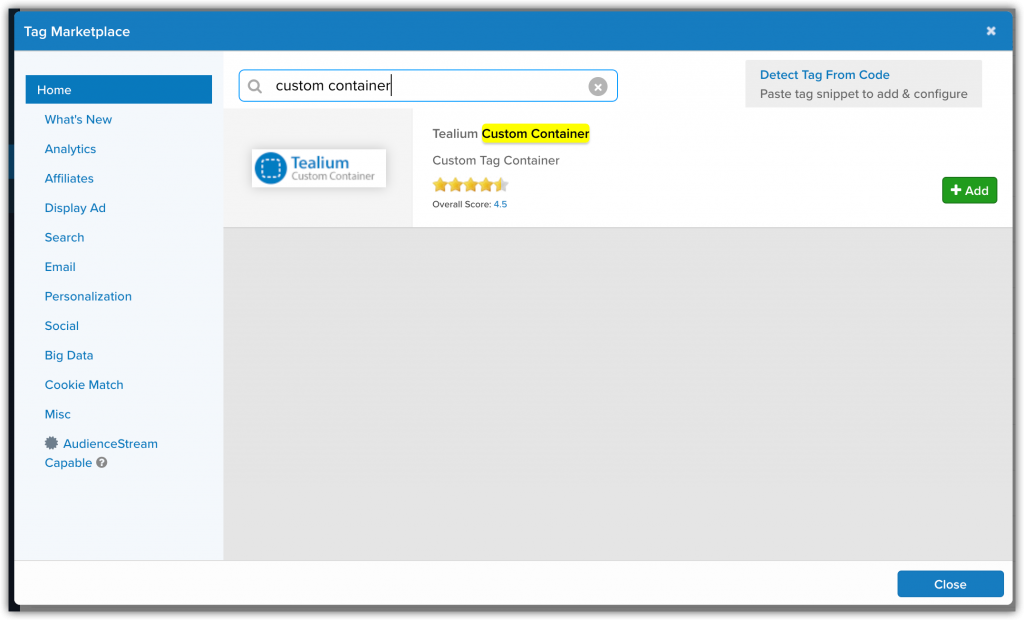
There is no template in TIQ yet, so you have to add it as a Custom Template script. Click “Add Tag”, then search for the Tealium Custom Container.
Name the new tag and click Save. You have to Save the profile before you can edit the template, so click the Save/Publish button and save the profile (don’t select any publish environments).
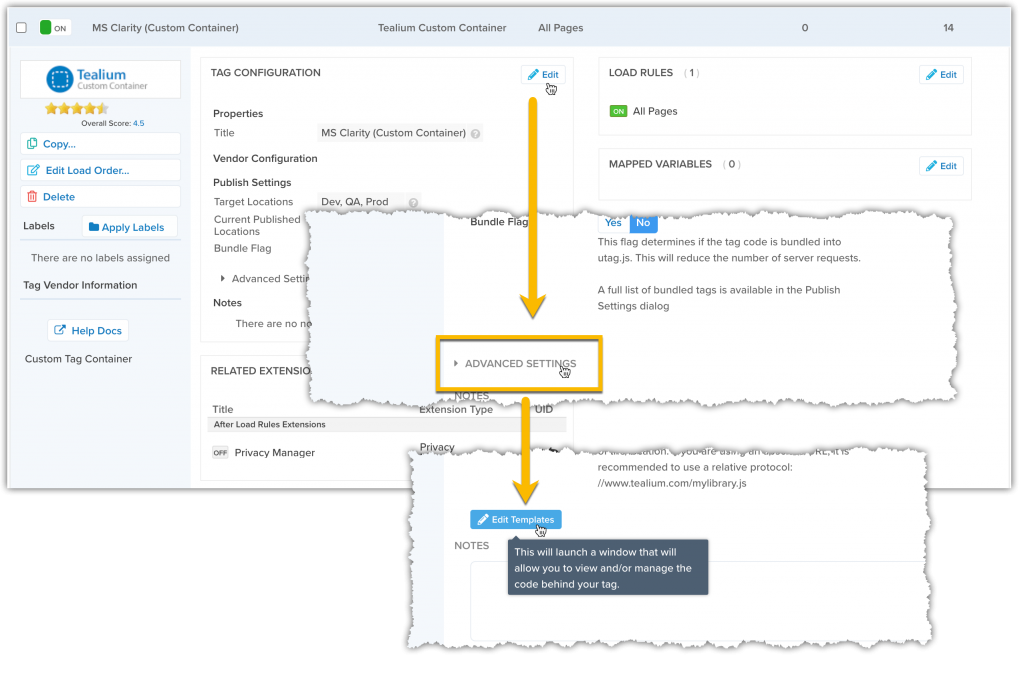
Open the new tag, click the Edit button in the Tag Configuration, then open Advanced Settings and find the Edit Template button.
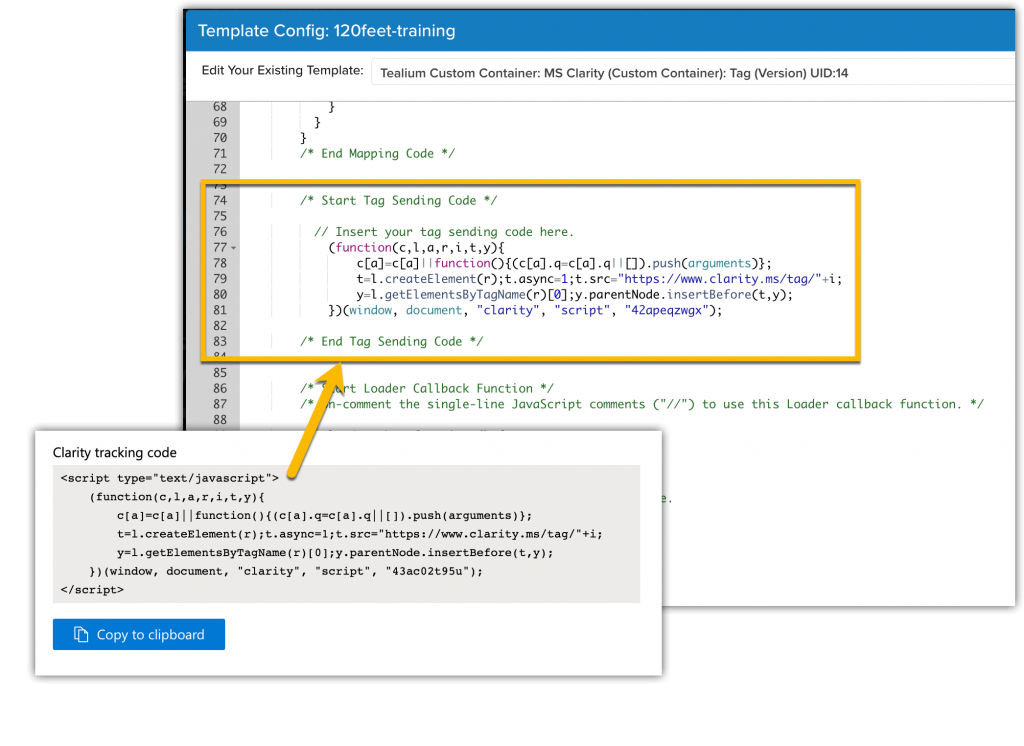
 You can then paste the code (without the script tags) from the Clarity Settings page in to the “Code Sending” part of the template:
Save and publish the tag.
Installing on Adobe Launch
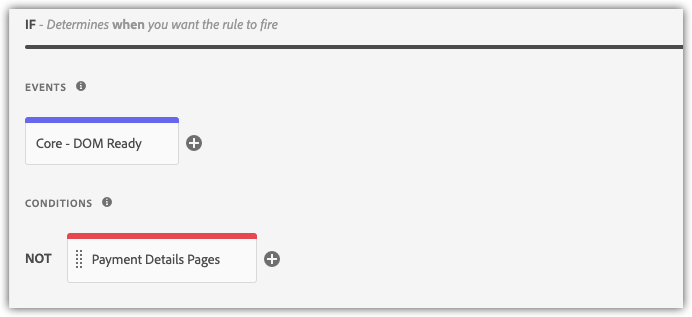
Add a new Rule. I used DOM Ready as the event. You don’t need this tag to fire before the page is ready, as we’re going to be looking at customer behaviour on the rendered page. You might want to play with earlier loading if your session replays show blocky page transitions or you seem to be missing customer interaction details at the start of the page view.
Add conditions for any pages that you don’t want to capture. For example, you may have security or privacy rules which specify you can’t capture customer interaction with things like credit card forms or customer account pages.
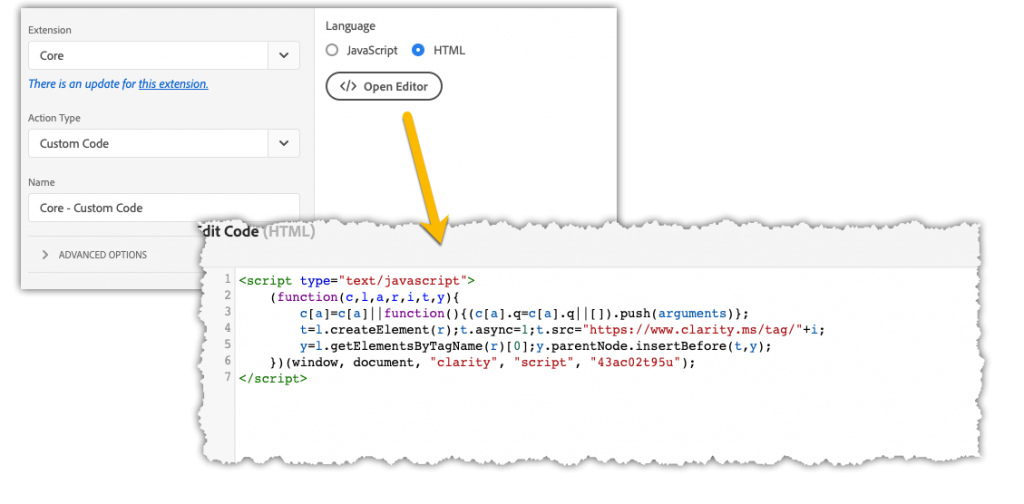
Add a custom code action and paste the script from Clarity in to the box. You can either do an HTML action and paste the whole lot in, or a JavaScript action and just paste the contents of the script tag in.
Save and build the library.
Default Reports
Clarity gives you three features without any configuration: Dashboard, Heatmaps and Recordings.
The dashboard gives a nice overview of sessions on your site with key metrics at the top and donut visualisations for bad experience indicators (dead clicks, rage clicks, excessive scrolling and quick backs). Additional visualisations for common segments, such as device, country, browsers, etc are shown below.
It’s not particularly fancy and it isn’t customisable at all, but it looks quite effective. And you can imagine being happy presenting this page to your site stake holders.
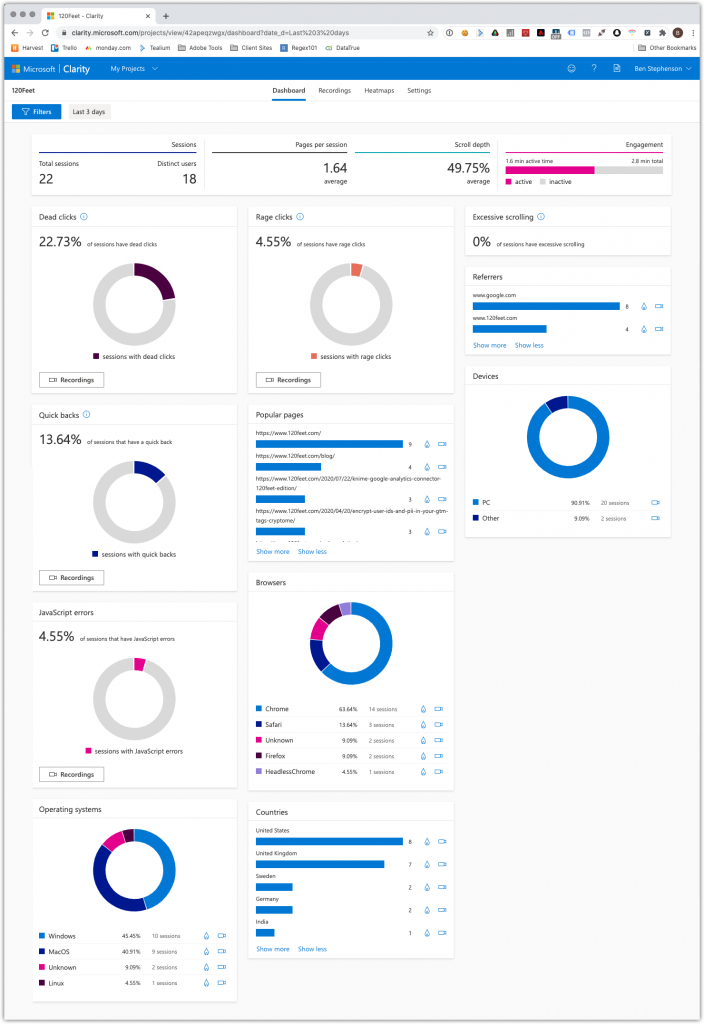
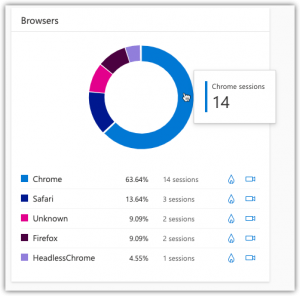
Hovering over elements of the graphs gives more detail about the values. Clicking creates a filter and applies it to the whole dashboard. The whole thing is very fast to refresh but this might be because we only have a little test data in this example.
You also get links from here to the heat maps and replays; clicking a link from this visualisation applies the filter and takes you to the relevant report.
The reports on Rage Clicks, Dead Clicks and Excessive Scrolling are nice inclusions out of the box and with no configuration required.
- Rage Clicks are when a user clicks rapidly on a small part of the site in a short time, usually because something they perceive as an active element isn’t doing anything. This can be a strong indicator that your site is not performant – buttons and links aren’t doing anything so visitors are clicking again and again.
- Dead Clicks are clicks on the page that don’t do anything. This is an indicator that you have elements on the page that look like active elements, and the visitor is trying to click them.
- Excessive Scrolling is when a visitor scrolls up and down the page rapidly or more frequently than expected. This could indicate that the content on your page is not organised very clearly.
- Quick Backs are pages where the visitor has loaded the page and then clicked the back button immediately. This indicates that your links aren’t clear, meaning people are navigating to pages that they don’t mean to.
Viewing a Recording
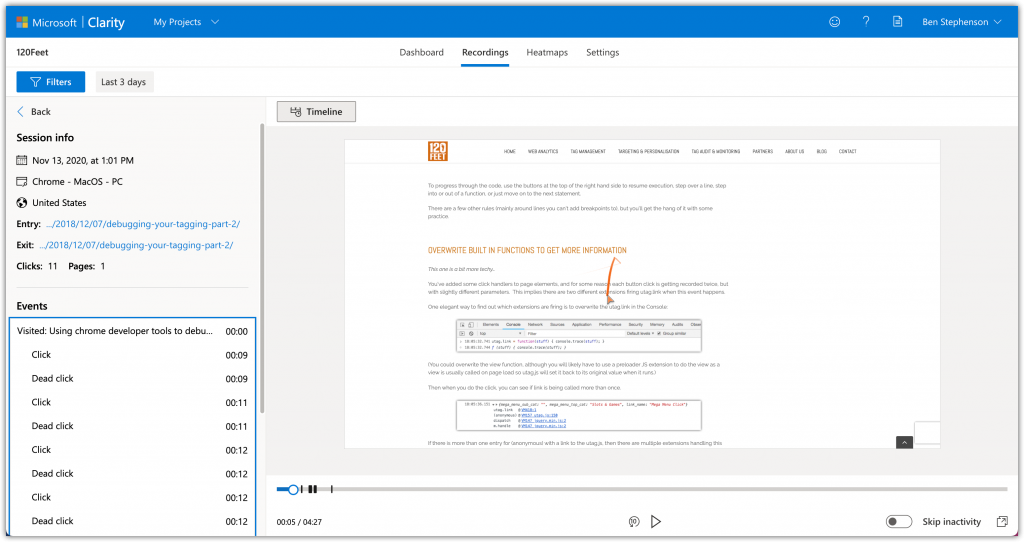
The Recordings viewer is fairly standard. A list of captured sessions is displayed down the left hand side. It displays the entry and exit page and date/time, browser, country, and duration of visit. When you’ve selected a session, the playback starts immediately in the main window. The mouse pointer is shown in orange and leaves a tail as it moves, to make it easier to follow.
The Timeline button in the top displays a list of actions, as seen in the screenshot above. Clicking on an entry in this list jumps the playback to that point. There is also a clickable progress bar at the bottom, a play/pause button and a “jump back 10 seconds” button.
Again, there aren’t any configuration options or settings to customise anything but it delivers the basics of a session replay tool pretty well.
One common configuration option on other session replay tools is the ability to set up masks so that if your site asks for Personally Identifiable Information (PII), for example during your checkout, then this is not captured while the page interaction is still recorded. There doesn’t seem to be any configuration to set this up, or any way of adding additional code to the page to indicate which fields should be blocked. However, if you look closely, some data is starred out in the page replay:
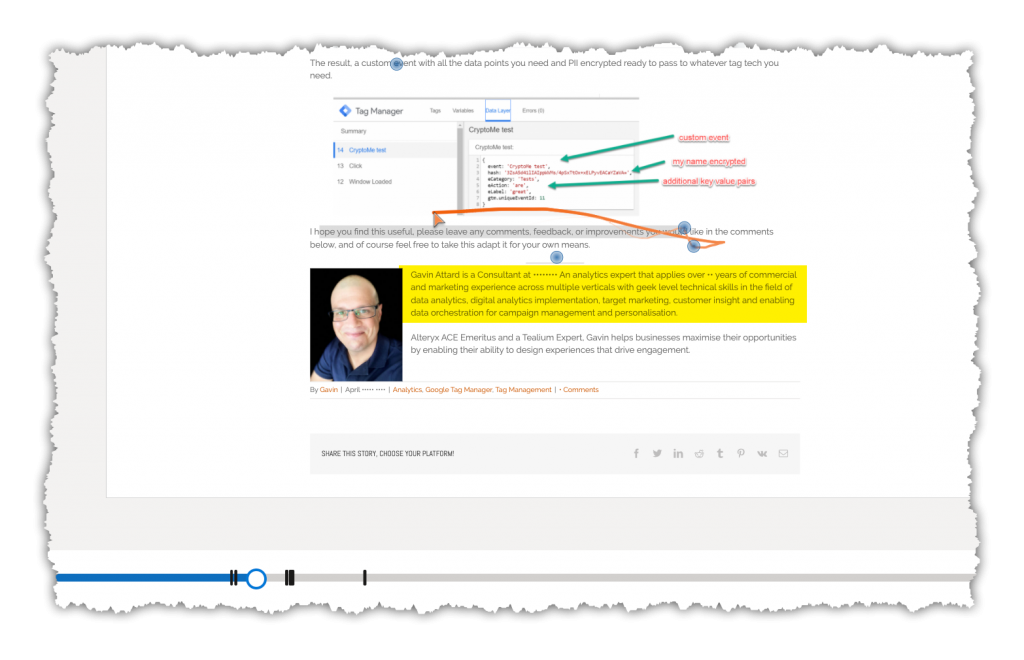
I’m not sure why the name of our company was starred. There are a few other names scattered through the article that are starred out as well. I did some testing to see if the form data captured in our Comments section was starred out but my session doesn’t seem to have been captured correctly (more on this later).
Heatmap
The heatmap tool is the one that seems to be still in development and currently is not very useful. Although it may just be that we don’t have enough traffic and clicks on our pages 🙂
Select a page URL in the textbox in the top left. You can start typing and the box will become a drop down with available values. You can add filters based on the same criteria as in the other parts of the tool.
There are two types of heatmap, click and scroll. At the time of writing, only the click maps are available. The clicks are displayed as coloured areas overlaid on the page.
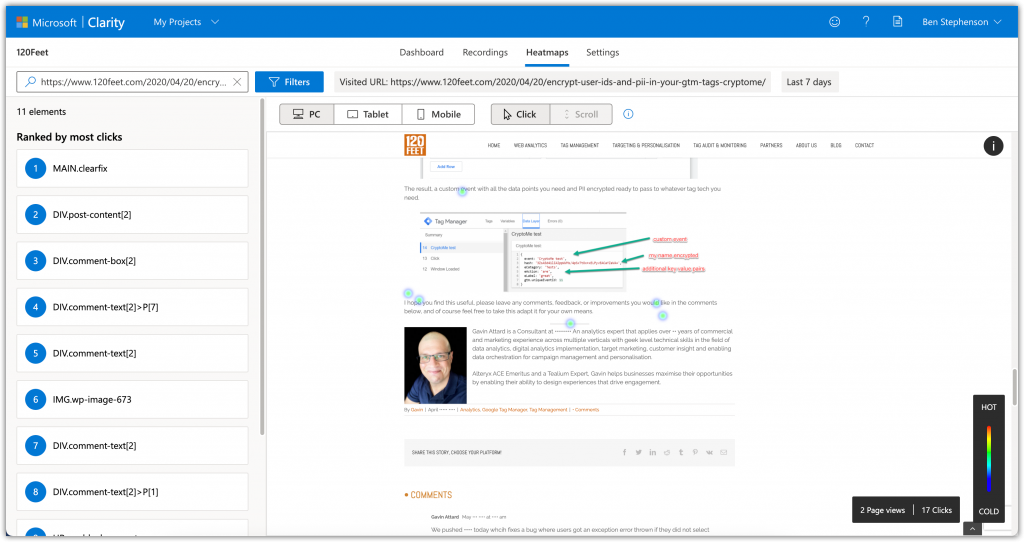
This would be clearer on a page with more clicks but for some reason this is the only page that Clarity is picking up as having clicks on it. The list in the left panel shows the page elements that have been clicked; selecting one jumps to the element in the main view. This feature also seemed a bit buggy on this page and after selecting one of these items, the scrolling in the main window didn’t work consistently and it seems to be impossible to unselect one.
Summary and Final Thoughts
That Microsoft have released this tool for free is surprising and welcome. There are a lot of sites out there who use GA free and would like some additional insights but don’t have the budgets for [often] expensive, “enterprise” level behavioural analysis and UX tools.
Could it be an indicator that Microsoft are going to try to expand their Bing offering from Search/Advertising and try to build a toolset to compete with Google Analytics? It seems odd that they would start with a Session Replay / Heatmap tool if this is the case.
The installation is straightforward, whether you use a free or a paid for TMS. The initial dashboard is impressive and just that on its own could be very useful for small site owners. Whether the rest of the tool can be improved to reach a level where it could be used “in anger” to compete with the more common (and expensive) alternatives remains to be seen.
The reports seem to be missing a lot of data. I’ve been on several different pages numerous times via two different laptops and my phone, but the majority of my visits/clicks aren’t showing in either of the tools. There aren’t any settings for sample rates and sampling isn’t mentioned anywhere [and our data volumes are tiny], so I would assume it set to capture all visit data but there are definitely sessions missing.
There is also a delay in the data being available, which is maybe expected from a free tool. However the competition such as Decibel Insight, is able to give almost real-time replays and it is possible to view a recording while the session is still active. This, combined with the missing sessions, can make it a bit annoying to use; is the data just delayed or is it not working correctly? I can imagine this would get more annoying on a busier site if you were reliant on this data.
I’d want to see some more configuration options, particularly around privacy on the session replay tool, and more consistency from the heatmap tool before I suggested a client use this as an every day analysis tool. Hopefully rapid product updates will follow.
Ben Stephenson has worked as a consultant for 120Feet for four years. Before 120Feet he had ten years of development experience on ecommerce websites and five years of digital marketing experience as an ecommerce manager looking after a large multinational collection of websites for a Travel and Tourism company. He is an official Tealium Expert (with the polo shirt to prove it!) and spends most of his working days in Adobe Analytics, Tealium iQ, and Adobe Launch.
In his spare time he plays guitar, builds Lego and takes photos.