Recently we started utilising Knime as an APA for a couple of clients. If you’re not familiar with what an APA (Analytic Process Automation) platform is I’ll be posting about this shortly and why you won’t be able to live without one.
Suffice to say, they are game changing enablers of data analysis with little to no coding requirement and they are winning-over data analysts and data scientists as well as transforming organisations into true data-driven enterprises by enabling domain expert users to be data heroes.
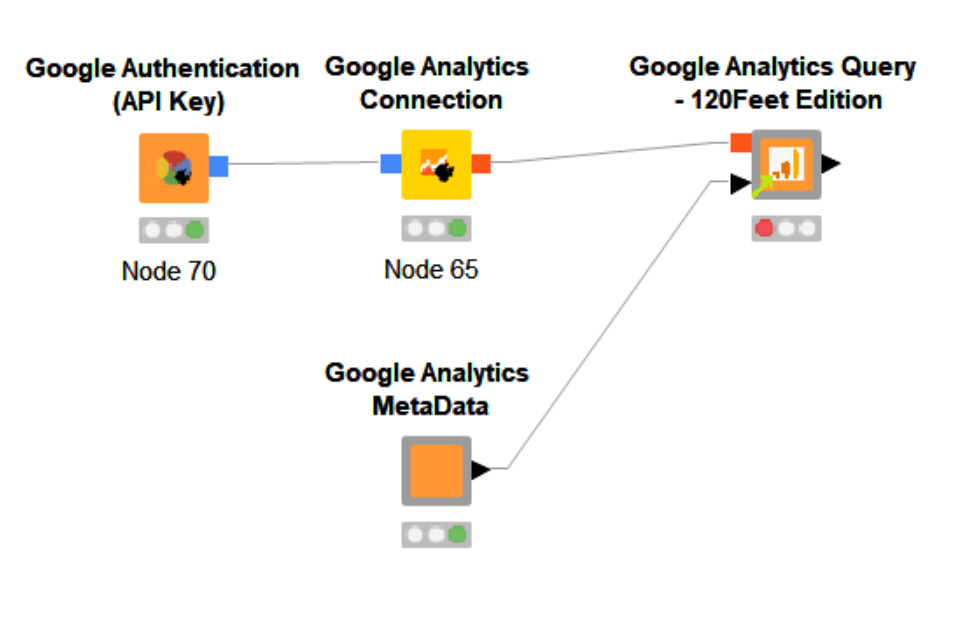
Back to Knime, we were finding that while the Google Analytics connector it had was good, it lacked a couple of features.
Namely, it could not handle:
- Re-try on fail
- The node randomly fails with a read timeout error. (Also, there are a number of other reasons the node connection can fail.)
- Pagination
- When the query generates more than 10K rows, there is an issue to call the next page(s).
- Accuracy, or rather how to avoid sampling
- The GA Reporting API will use Sampling when the request uses lots of data for the requested metrics (which normally occurs for any request for data over more than one day if the website is busy). This leads to data not correlating with the GA UI and/or inaccurate metrics (I’ve seen cases where the metrics returned were way off trend and caused many a headache and discussion with stakeholders about data ‘trust’, sources of truth and the like).
All three issues make Knime unworkable as a solution to source data from Google Analytics in an automated way.
But this is the beauty of a good APA, it’s malleable. A fantastic sandbox where you can build-out the solutions you need quickly without resorting to coding.

The 120Feet Edition of the Google Analytics Query Node for Knime
So, I set about wrapping the Knime provided connector in a Component with solutions for all three of the above issues. The results of which are now available via the Knime Hub – The Google Analytics Query – 120Feet Edition.
Here’s what I did to get there. Hopefully it will also give you an insight into solution and component building in Knime (the equivalent of Macros in Alteryx) and the powerful looping features.
The Solution
Re-try on Fail
I started by tackling the re-try on fail issue. When the connection failed for whatever reason, it would simply error and stop the node from functioning. So any hopes of an automated workflow are dashed if I have to keep re-starting every time the node had a network connectivity issue or I was momentarily hitting the API connection limitations.
Knime provides 2 sets of nodes that would prove to be the solution.
The first are the Try Catch nodes.
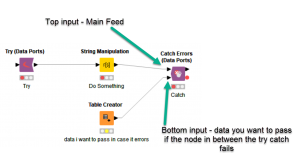
As the name implies, they work just like the Try Catch you may already be familiar with if you do any form of analytics implementation or coding. By wrapping the query node between a Try and a Catch node, Knime will try what’s in-between and if it fails it handles the error and passes whatever data you have coming into the bottom input. So now we have error handling.
The second part of the solution is in the form of Loop nodes. Their basic function, as the name suggests, is to loop through the nodes in between a Start Loop and an End Loop. The difference between the loop nodes is how you control the number of loops that occur.
In this case I opted for a Recursive Loop. For Alteryx users this functions just like an iterative macro. The recursive loop will take data fed to the top input and pass it to its output. Any rows fed to the bottom input are simply returned to the start of the loop for another go. With no rows fed to the bottom input there is nothing to loop on, so the looping stops.
For this use case I built some logic around the the output from the Catch node. By feeding the stream containing the query parameters for the Google Analytics Query node to the bottom input of the Catch node, should the Google Analytics Query node fail the Catch node would pass the query parameters through instead.
The logic then checks if the output of the Catch had one of the query parameters present – if it did it means it failed – so it passes the data to the bottom input of the recursive loop end and re-runs the query. This keeps happening until the Google Analytics Query node returns the data we are asking for.
Now I have my retry on fail and this is my innermost loop.
Pagination
I’m now confident my queries won’t fail, so I set to task on handling pagination.
The Google API allows you set a maximum row return count of 10,000 rows. You can declare a starting index, so if you wanted row 10001, you simply set the starting index to that value.
To solve this I was going to need another recursive loop. I had to figure out when we hit 10,000 rows then send the query parameters with an updated starting index back through the loop.
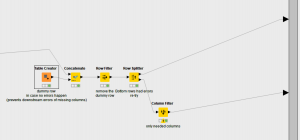
To create the logic I used a set of “If Then” End Nodes, kind of like the detour tools in Alteryx. These nodes allow you to pass the data into one of two streams depending on a condition. This is great if you need to treat data differently in a part of your workflow.
In this case, after counting the number of rows returned form my query, a Rule Builder node is set to check if the value is equal to 10,000. If it is then it sets the condition to pass the data via the Top output of the If node. Otherwise it would pass the data to the bottom.
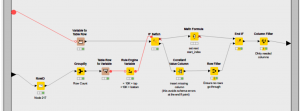
Now that I knew the top row meant I needed the next page, so I used the iteration number and a simple multiplication and addition formula in a Math node to get the starting index ((iteration number * 1000)+1) then passed this to the recursive end bottom input. Therefore, the query with an updated starting index gets passed back to the connector calling the next set of rows. This happens until the number of rows returns is less than 10K meaning there re no further rows to fetch.
I wrapped my innermost re-try on fail loop in this pagination loop.
Avoid Sampling
If you are familiar with GA Sampling (the little green or orange shield next to you report name), you’ll know that sampling usually occurs when you are requesting too much data to process. Depending on how busy you site is, it could mean anything over 2 days worth of aggregation or more.
It does not normally sample on a single days’ data (or at least, I’m yet to hit an occasion when it does that).
So, if I needed data from the start to the end of any given month, if each day was called independently, the data returned would be unsampled. I can then handle the aggregations in Knime or further downstream in my analytics stack if I need to. Note, this solution works great with session based metrics, User metrics (like number of users) won’t aggregate over time properly, however more on how to handle this in another post coming soon.

The solution for this required in the first instance generating each date between the selected start and end dates. I then used the Table to variable loop. This allows you to feed the data as a flow variable to a node (this way you can change its settings). The loop feeds each row one by one until all parameter iterations are complete. Again if you are coming at this from an Alteryx background it’s like using a condition tool in a macro.
My previous two loops are wrapped in this loop.
In Summary
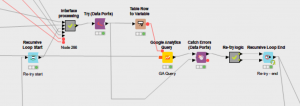
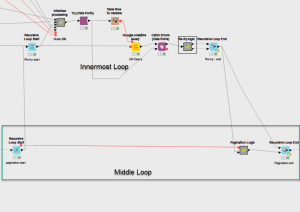
So, now I have a nested loop solution to fix the issues.
The outermost loop requests the data for each date between the start and end date. The middle loop checks if we need to call additional pages for each of those. And the innermost loop re-tries if any of those queries fails.
Next, I selected all my nodes and wrapped them in a component. The rest of the nodes in there allowed me to create an interface for the component. If you are interested you can read more about how I built those here.
I hope you find the node useful if you are using Knime, and if you aren’t yet, well head over there, install it (it’s free!) and start your journey into code-less digital analytics.
 Gavin Attard is a Consultant at 120Feet. An analytics expert that applies over 15 years of commercial and marketing experience across multiple verticals with geek level technical skills in the field of data analytics, digital analytics implementation, target marketing, customer insight and enabling data orchestration for campaign management and personalisation.
Alteryx ACE Emeritus and a Tealium Expert, Gavin helps businesses maximise their opportunities by enabling their capability to draw insight and design experiences that drive engagement.
Leave A Comment