A couple of years ago, Adobe Analytics released a Page Timing plug-in which measured ten different page speed metrics. You added the code to your doPlugins() function, set up nine numeric events and a counter event, and as the visitor browsed the site the different timing values were captured in a cookie and reported on load of the next page.
This was ok until about 18 months ago when the code was removed from the Adobe Plug-Ins list, and ClientCare started denying all knowledge of it.
The code was based around a JS object in the browser called performance.timing. This object has now been deprecated, which is presumably why Adobe pulled their plug-in.
There were a few other issues with the plug-in:
- it relied on cookies;
- it needed Previous Page Name to be caught (using a different plug-in, load times were reported on load of the next page);
- it then relied on you remembering to use Previous Page Name in your dashboards;
- if you wanted to breakdown by something else, you needed to also capture that in a Previous Value cookie (we mainly use Previous Page Type);
- it didn’t always fire – something we never quite got to the bottom of;
- it would never give you load times of your exit page (which in an ecommerce site could well be your order confirmation page).
Recently a client asked if we could capture the page load time in a delayed Custom Link call fired on the same page. I didn’t want to try to reuse the same deprecated object to do this, so I wrote new code using the replacement object: performance.navigation.
Firing a delayed Custom Link call
The first thing to do is set up a delayed custom link call. If you are using Adobe Launch then this is a simple case of adding a new rule with the “Time on page” condition:
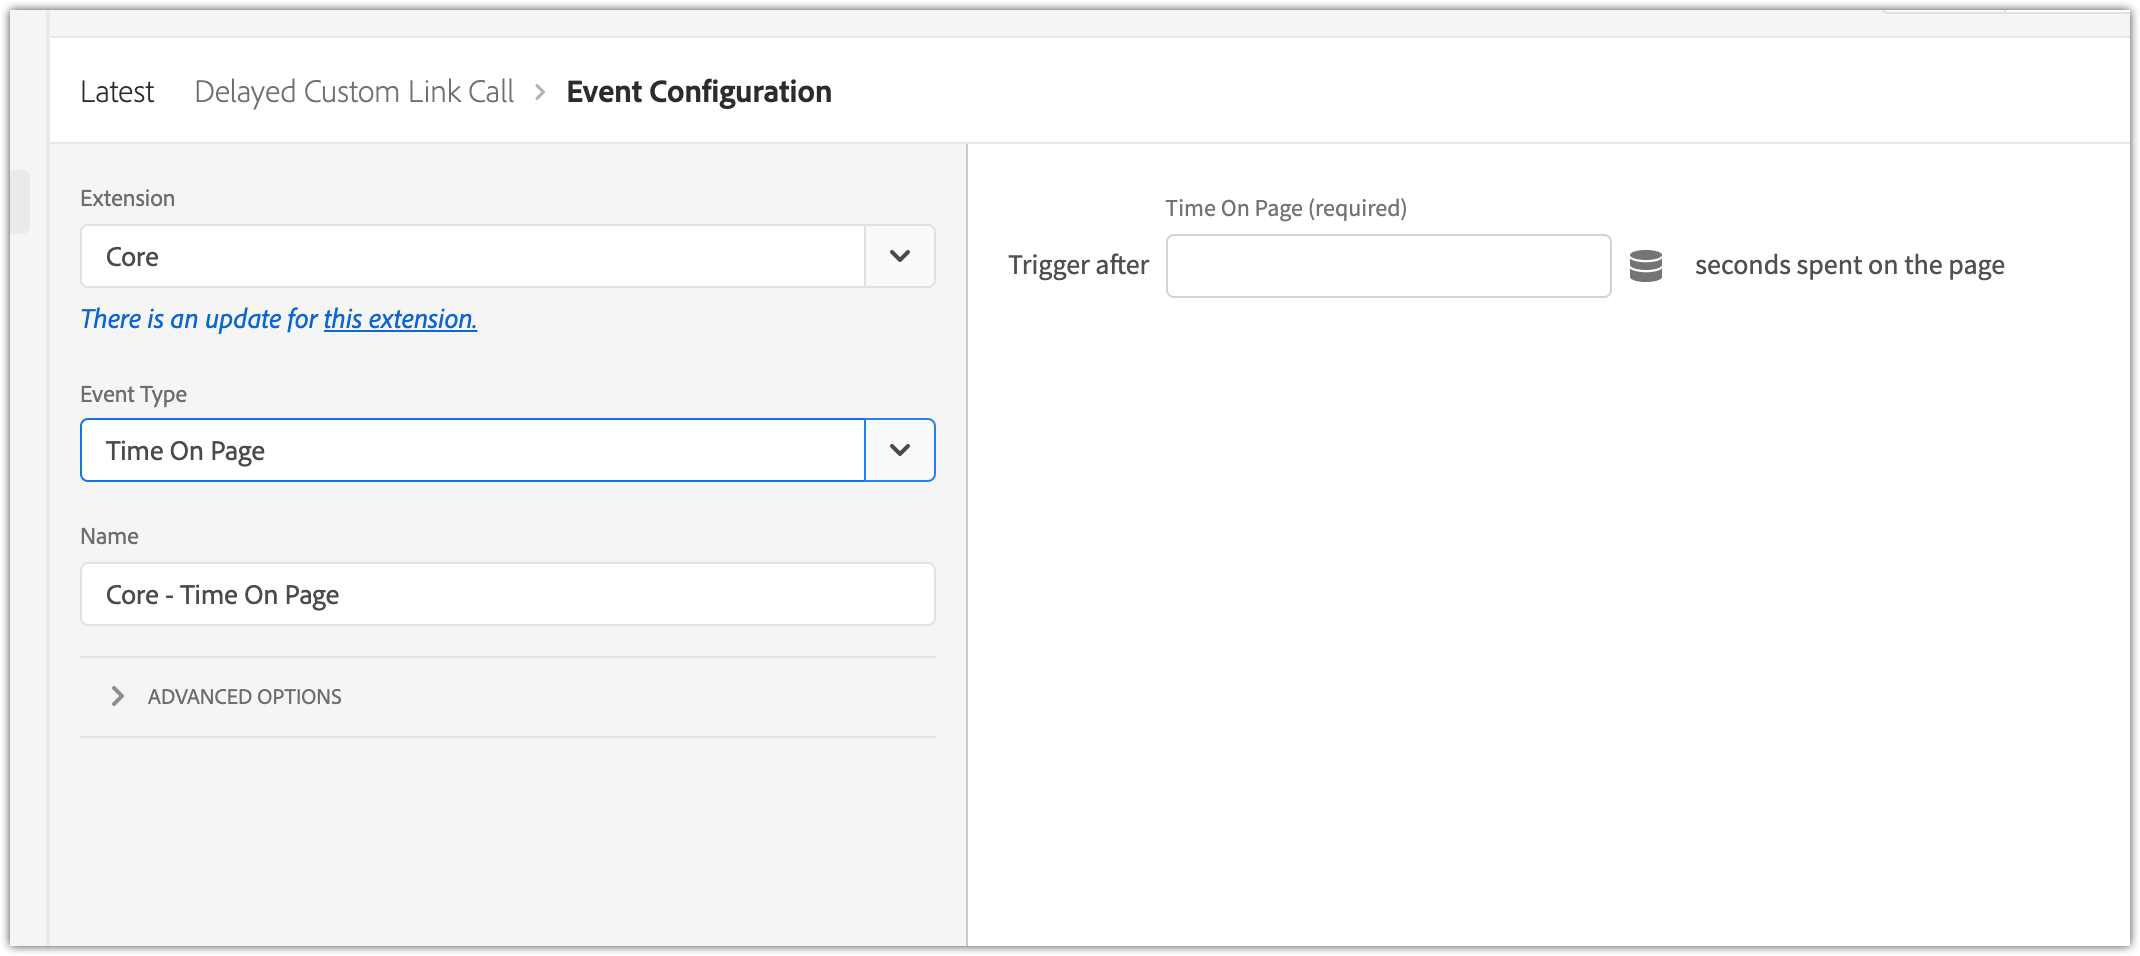
Adobe Launch event configuration
Enter the timeout in seconds in the configuration section and set up your Custom Link using the Adobe Analytics Set Variables (using the Custom Code section) and Send Beacon actions.
However this client is using Tealium, so we had to add a Custom JavaScript extension and handle the delay ourselves. This can be done using the JavaScript setTimout function:
var delay = 7500; //time to wait in milliseconds

setTimeout(function() {
  //do something here
}, delay);
The next question is: how long to wait before triggering the call?
You could use the Adobe dimension Time Spent on Page. However, this dimension actually captures the time between a hit and the next hit, not the time spent on a page. If your implementation involves hits between page views (ie tracking any interaction with the page or video plays, etc) then this metric is basically meaningless.
After doing some testing on the client site, we found you need to wait a few seconds for the performance object to be populated. But you don’t want to wait too long otherwise people are more likely to click on to the next page and you’ll lose the tracking. So we opted for a period of 5 seconds, and will monitor the reports and fine tune as appropriate.
Reading the data from the browser object
The performance object has a number of properties:
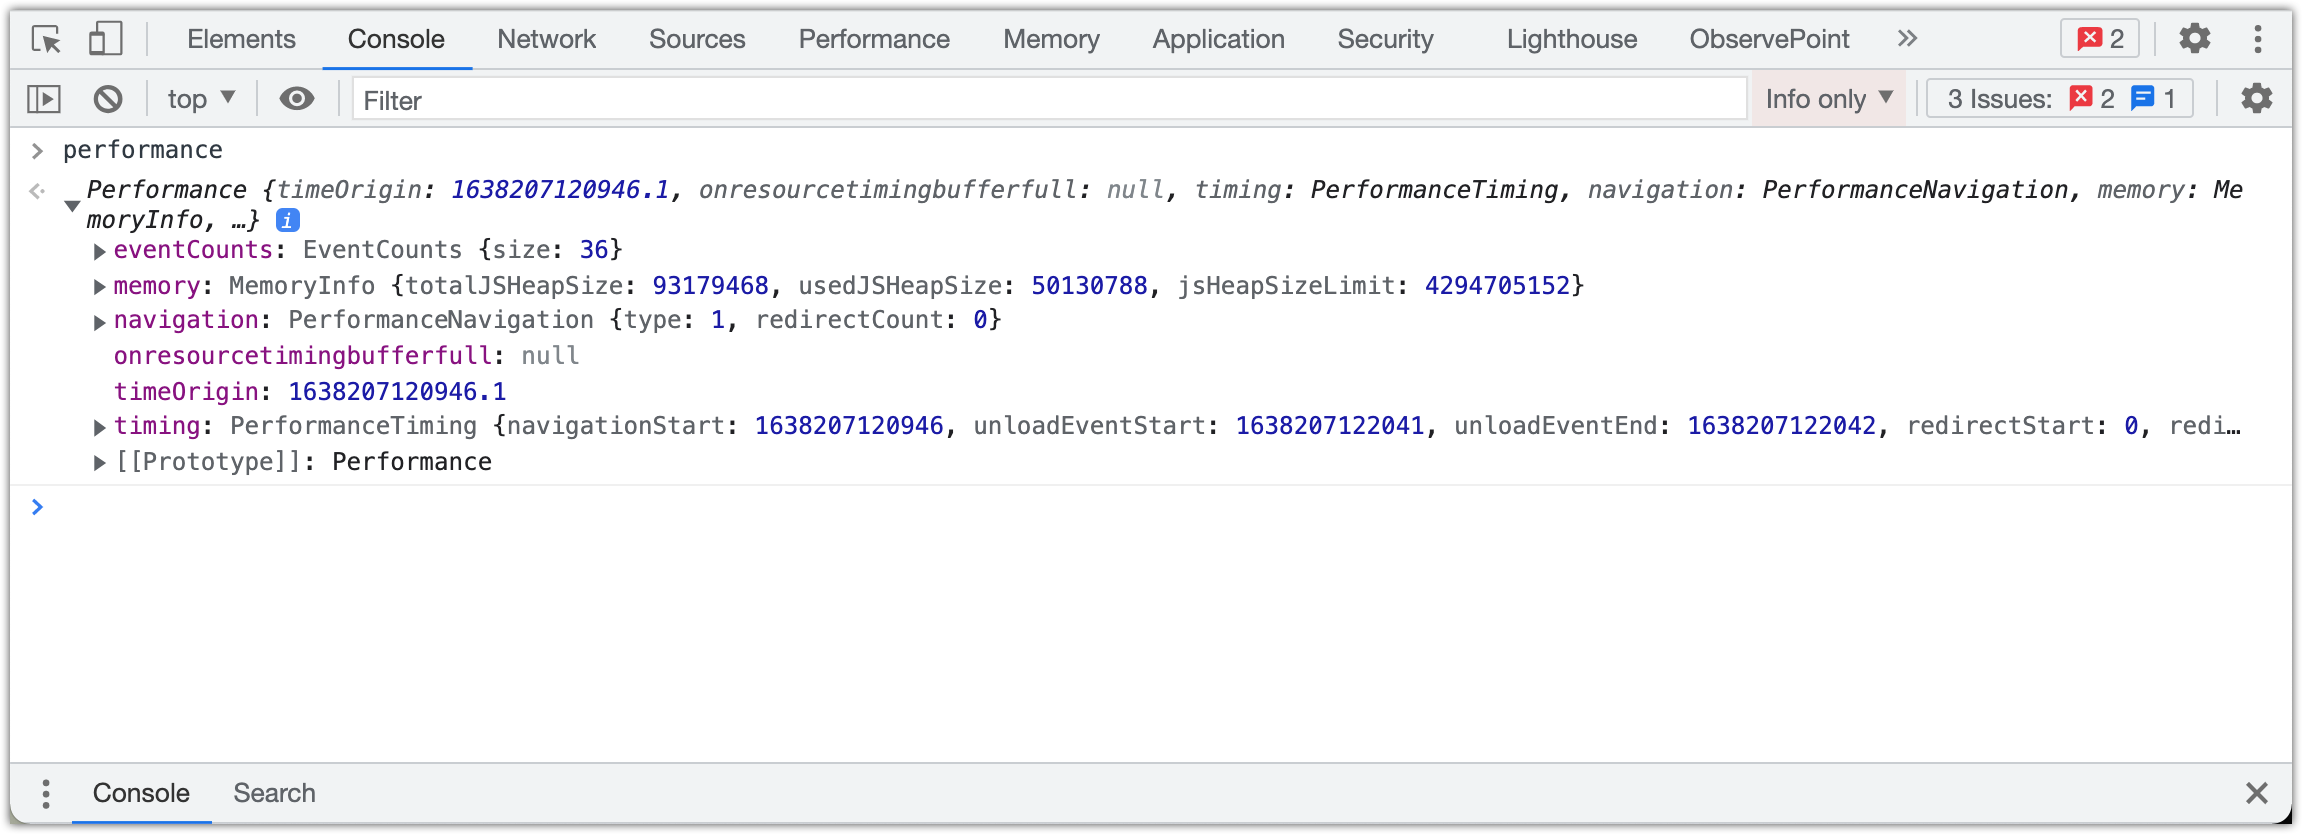
The properties of the performance browser object
The last one in this screenshot, timing, is the one that has been deprecated. The replacement objects are under the navigation property.
You access them using the getEntriesByType(string) method on the performance object, which returns an array of PerformanceNavigationTiming objects (in my testing it only ever returned a single one):
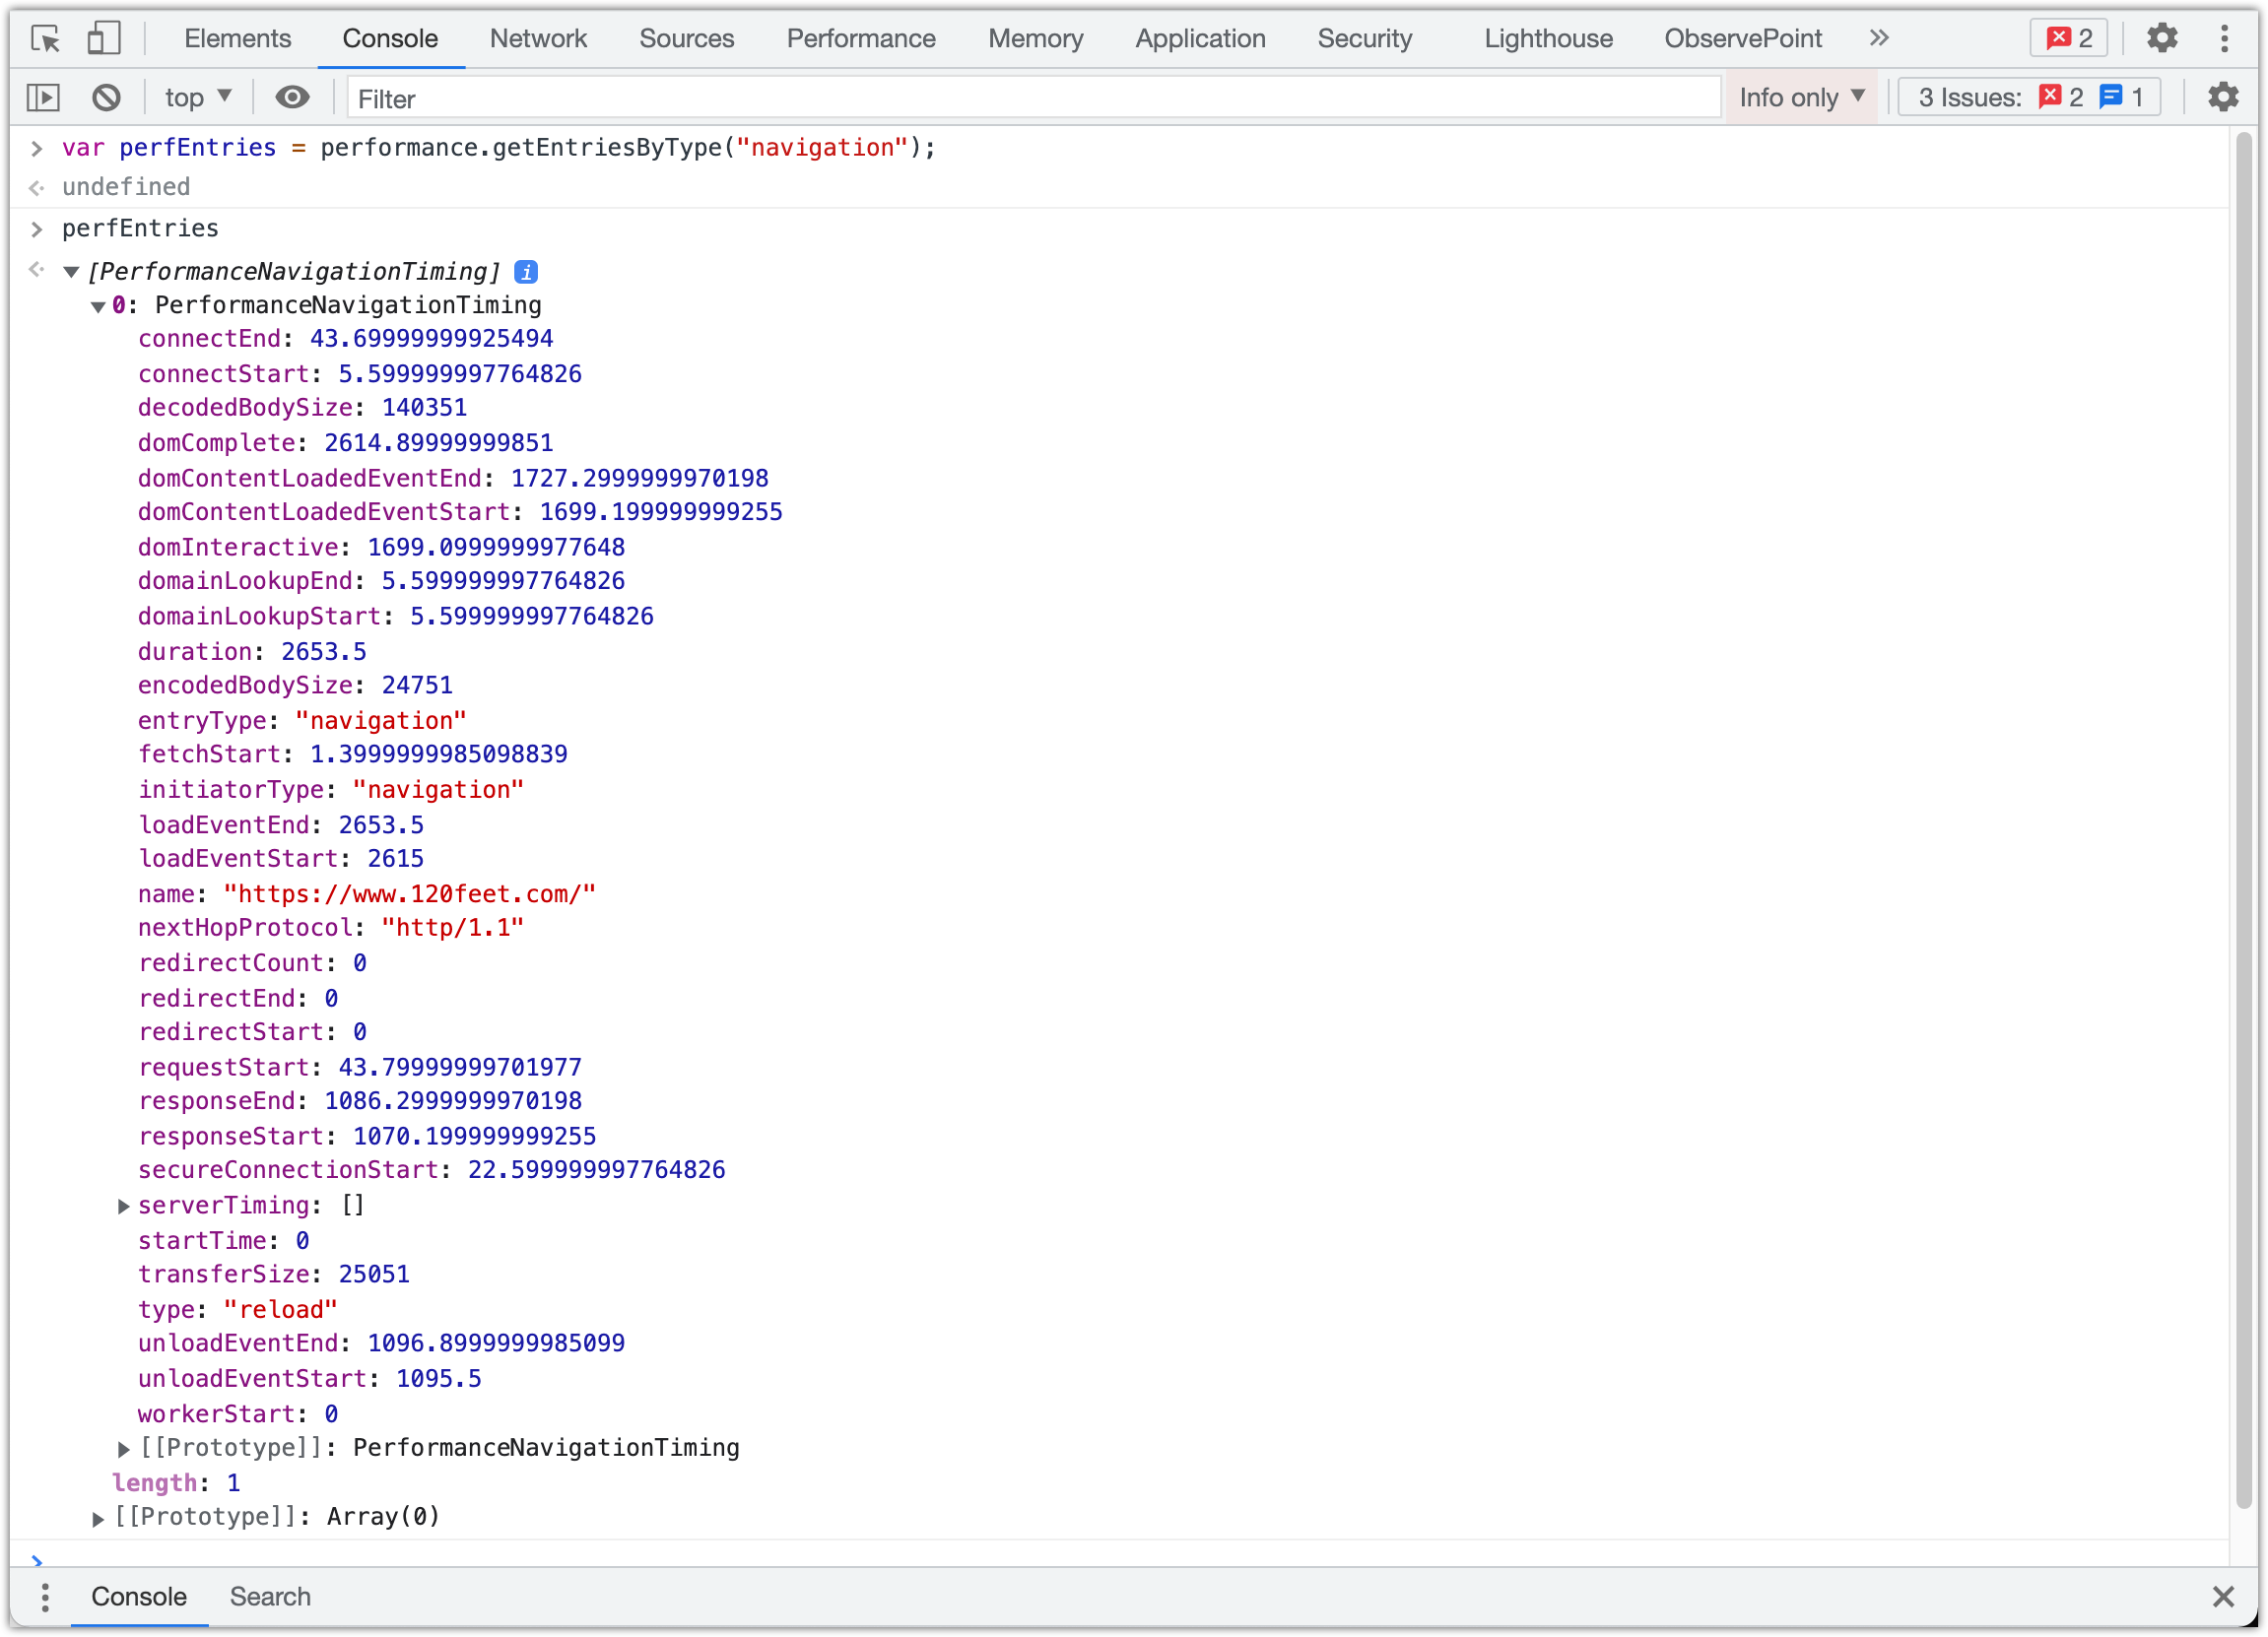
The details of the PerformanceNavigationTiming object
There are two additional metrics you can capture, “Time To First Paint” and “Time To First Contentful Paint“. These measure the time for the browser to render the first visible item to the browser window. They are not in the “navigation” property but in a separate one called “paint”:

The details of the PerformancePaintTiming object
Having pulled those objects back, you have to do is a bit of maths to work out durations (generally “end” minus “start”), and map to some events!
We used the same set of event timings as was available in the original plug-in. This means we can compare the times recorded by the new method to the times recorded by the old method (remembering to break down by page name for new and previous page name for old).
The old timing objects were captured as Epoch Timestamps, whereas the new ones are captured as number of milliseconds since the request started. There is a startTime property which should be “0”, and everything else is the number of milliseconds after this.
The timings that we capture are:
| Redirect | fetchStart – startTime |
| App Cache | domainLookupStart – fetchStart |
| DNS Look Up | domainLookupEnd – domainLookupStart |
| TCP Connection | connectEnd – connectStart |
| Request | responseStart – connectEnd |
| Response | responseEnd – responseStart |
| Processing | domComplete – responseStart |
| Loading | loadEventEnd – loadEventStart |
| Total Page Load | loadEventEnd – startTime |
| Time To Interactive | domInteractive – connectStart |
If you want to report in seconds divide the result by 1000, and append .toFixed(2).
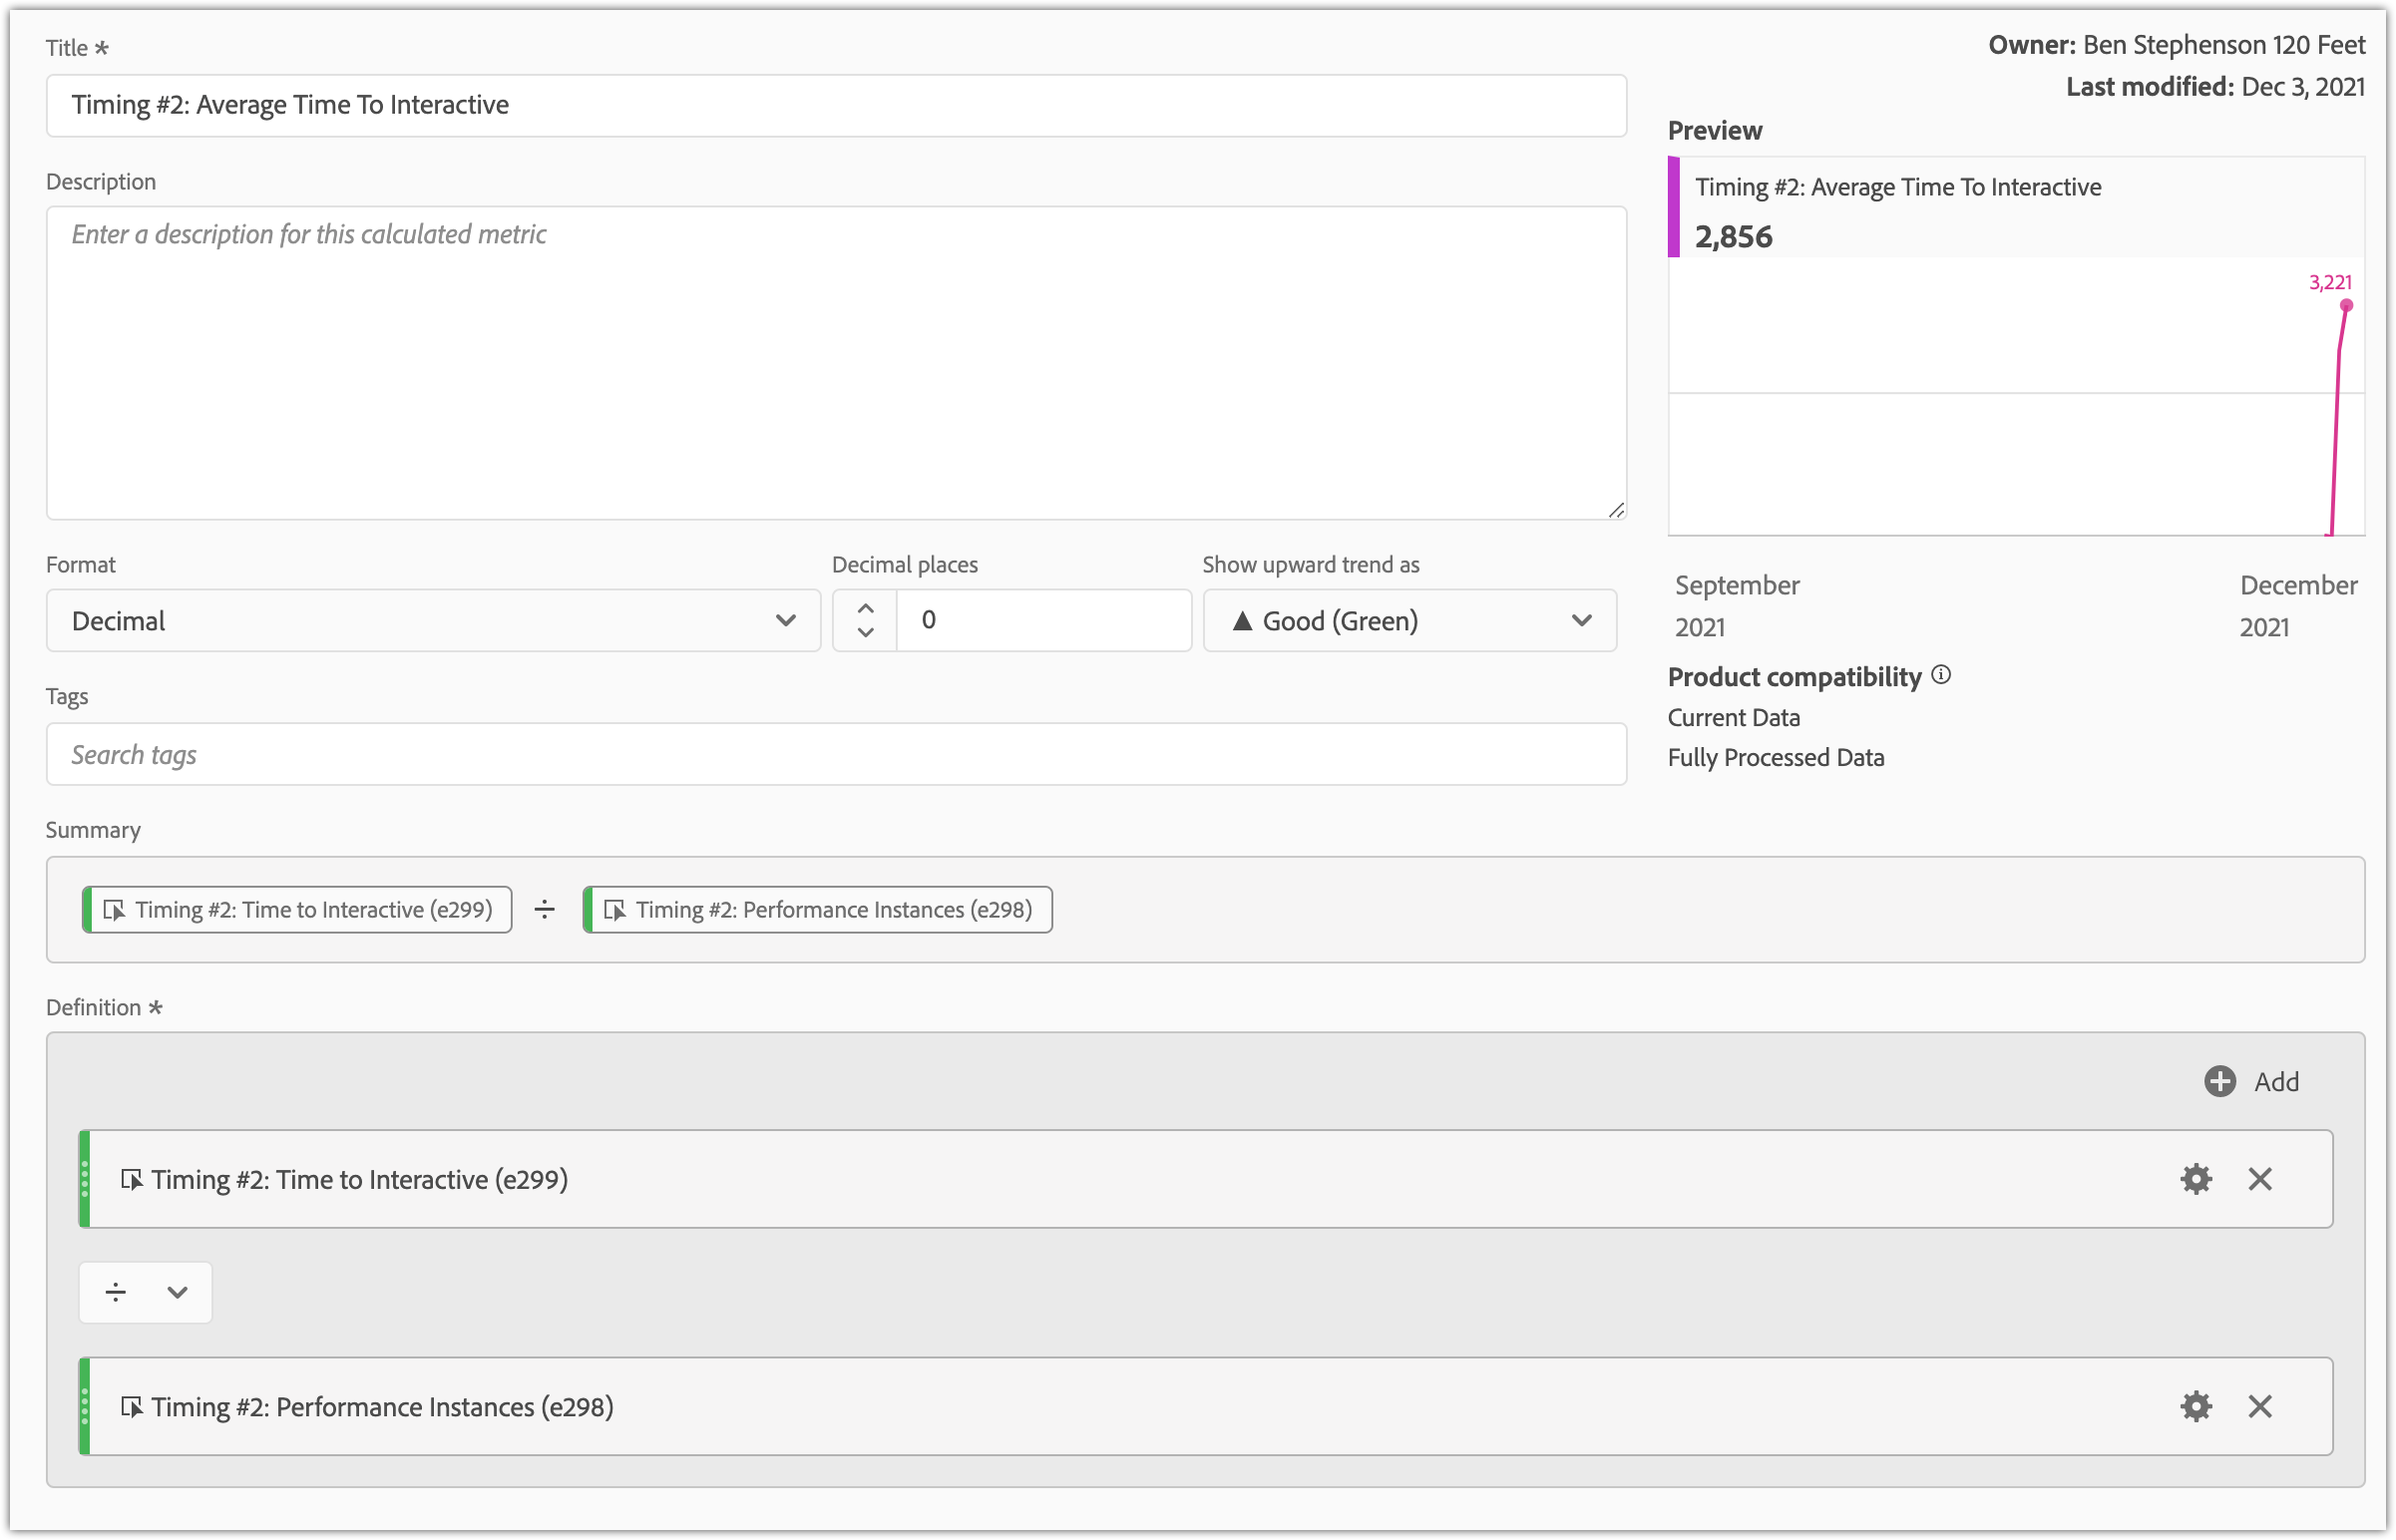
Finally, we set up the objects for the custom link call, updating s.linkTrackVars and linkTrackEvents, then building the events string. As well as the numeric events we capture the timing in, we also have a single counter event (300 in the example code below) which is the instances metric. We use this to calculate the average of each of the other metrics (sum of events / instances) into a set of calculated metrics.
The full code is shown below:
var delay = 5000;

setTimeout(function() {
    console.log("Waited for " + delay + " ms");

    var perfEntries = performance.getEntriesByType("navigation");

    var redirect,appCache,dns,tcp,request,response,processing,on_load,totalpageload,timetointeractive,firstcontentfulpaint;

    for (var i=0; i < perfEntries.length; i++) {
        console.log("Performance Navigation entry[" + i + "]");
        var pt = perfEntries[i];

        redirect = parseInt(pt.fetchStart - pt.startTime); // e289
        appCache = parseInt(pt.domainLookupStart - pt.fetchStart); // e290
        dns = parseInt(pt.domainLookupEnd - pt.domainLookupStart); // e291
        tcp = parseInt(pt.connectEnd - pt.connectStart); //e292
        request = parseInt(pt.responseStart - pt.connectEnd); // e293
        response = parseInt(pt.responseEnd - pt.responseStart); // e294
        processing = parseInt(pt.domComplete - pt.responseStart); //e295
        on_load = parseInt(pt.loadEventEnd - pt.loadEventStart); //e296
        totalpageload = parseInt(pt.loadEventEnd - pt.startTime); //e297
        timetointeractive = parseInt(pt.domInteractive - pt.connectStart); //e299
    }

    var paintTiming = performance.getEntriesByType("paint");
    //p[0].name == 'first-paint' / p[1].name == 'first-contentful-paint'

    for(var i=0; i< paintTiming.length; i++) {
        if(paintTiming[i].name === "first-contentful-paint") {
            console.log("300: first contentfulpaint : " + paintTiming[i].startTime);
            firstcontentfulpaint = (paintTiming[i].startTime/1000).toFixed(2);
        }
    }

    s.linkTrackVars = "events,eVar2";
    s.linkTrackEvents = "event289,event290,event291,event292,event293,event294,event295,event296,event297,event298,event299,event300";
    s.eVar2 = s.pageName;

    s.events = "event289="+redirect+","+
      "event290="+appCache+","+
      "event291="+dns+","+
      "event292="+tcp+","+
      "event293="+request+","+
      "event294="+response+","+
      "event295="+processing+","+
      "event296="+on_load+","+
      "event297="+totalpageload+","+
      "event298="+timetointeractive+","+
      "event299="+firstcontentfulpaint+",event300";

    s.tl(true, "o", "New Page Load Timing");


}, delay);
The calculated metrics to work out the averages look like this:
Using this average metric with the Hour dimension can give a report like this:
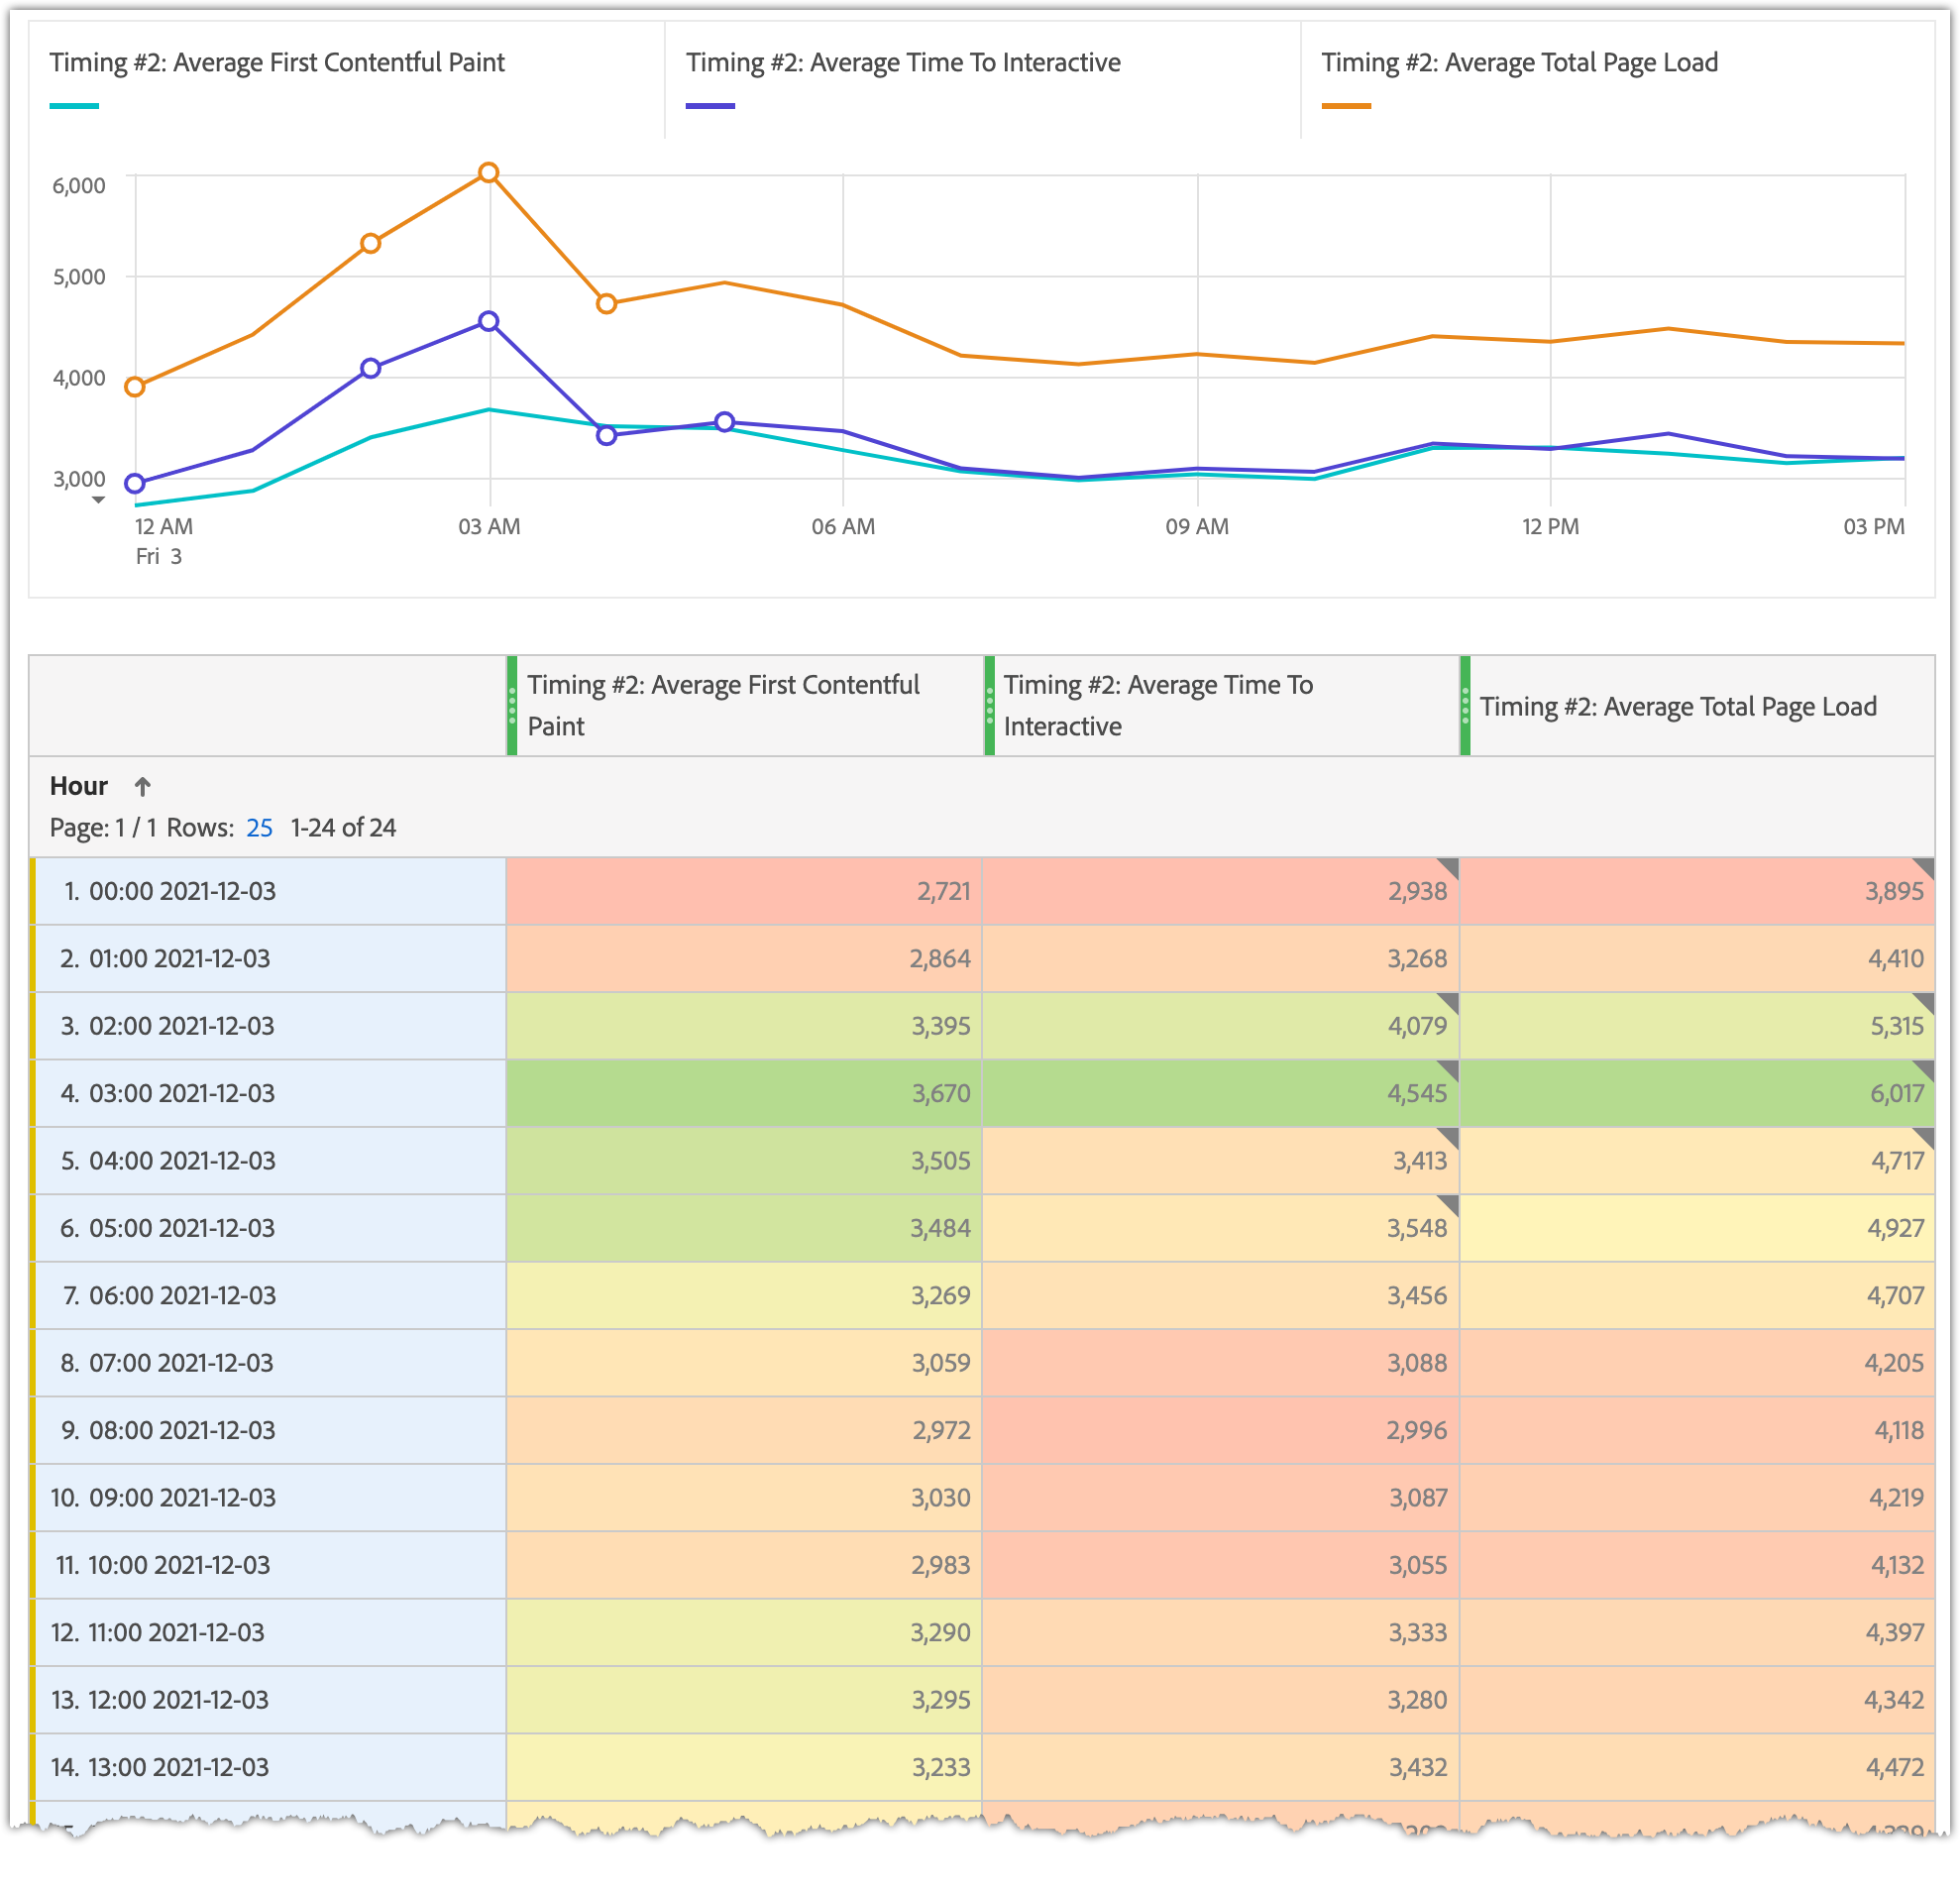
Example Adobe Analytics Page Load report
You could also use this metric to trigger alerts if it the number gets too high.
The next step is to review after a few days and make sure we’re capturing enough data to give a good timing indication. If the performance instance counter is a lot less than the page views, we can look at reducing the wait time to capture more people.
Happy page time reporting!
Ben Stephenson has worked as a consultant for 120Feet for five years. Before 120Feet he had ten years of development experience on ecommerce websites and five years of digital marketing experience as an ecommerce manager looking after a large multinational collection of websites for a Travel and Tourism company. He is an official Tealium Expert (with the polo shirt to prove it!) and spends most of his working days in Adobe Analytics, Adobe Launch and Tealium iQ.
In his spare time he plays guitar, goes cycling, builds Lego and takes photos. But not all at the same time.